Figure 4.
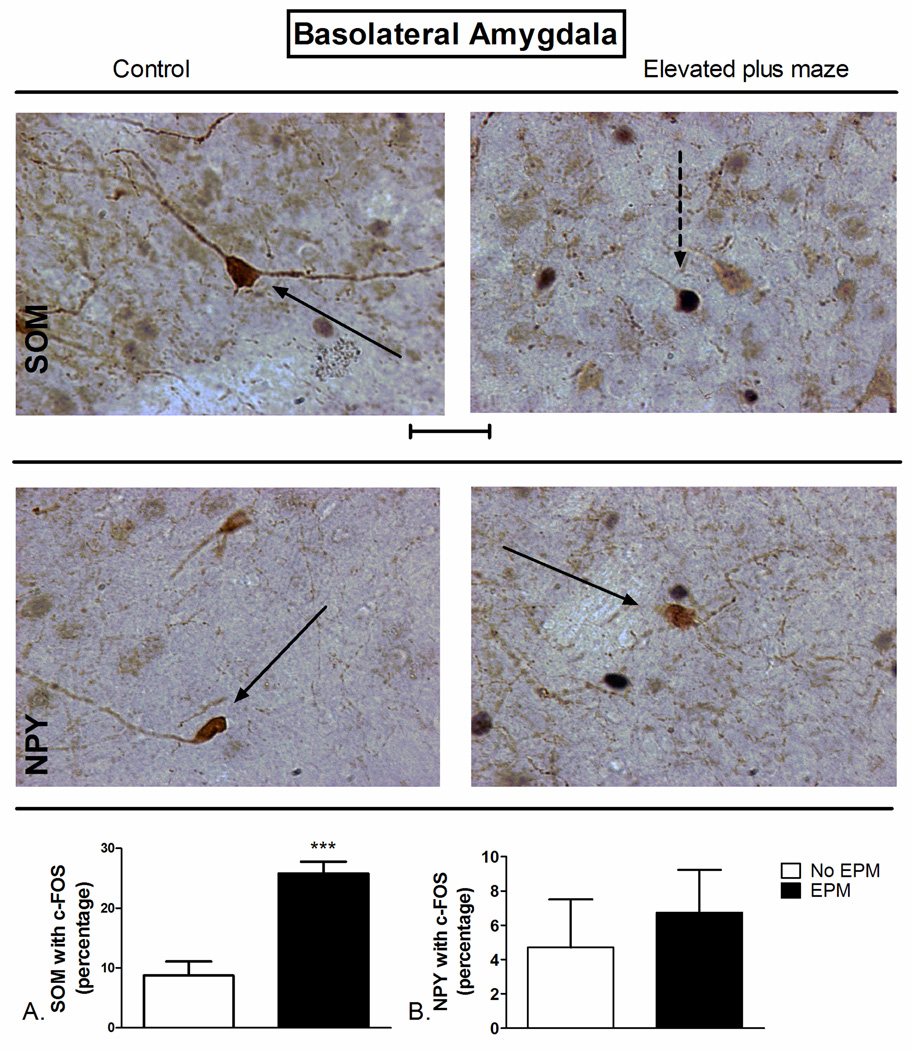
Elevated plus maze (EPM) exposure-induced changes in c-Fos expression of A) SOM+ and B) NPY+ neurons of the basolateral amygdala (BLA). (Top) Representative photomicrograph with SOM (brown) and c-Fos (blue/black) labeling in control (left) and EPM-exposed (right) rats. (Middle) Representative photomicrograph with NPY (brown) and c-Fos (blue/black) labeling in control (left) and EPM-exposed (right) rats. Exposure to the EPM increased the percentage of SOM-positive neurons with c-Fos in the BLA (Bottom, A) compared to controls. ***P<0.001 (N=4–5). The data represent cumulative counts from anterior and posterior sections. Percent SOM or NPY with c-Fos neurons represent: (the total number of double-labeled neurons / total NPY or SOM-labeled neurons) * 100. Pictures are at 40× magnification. Scale bar represents approximately 50 microns. The solid arrow points to a single-labeled neuron (blue/black = c-Fos and brown = SOM or NPY), and the dotted arrow points to a double-labeled SOM/c-Fos neuron.

