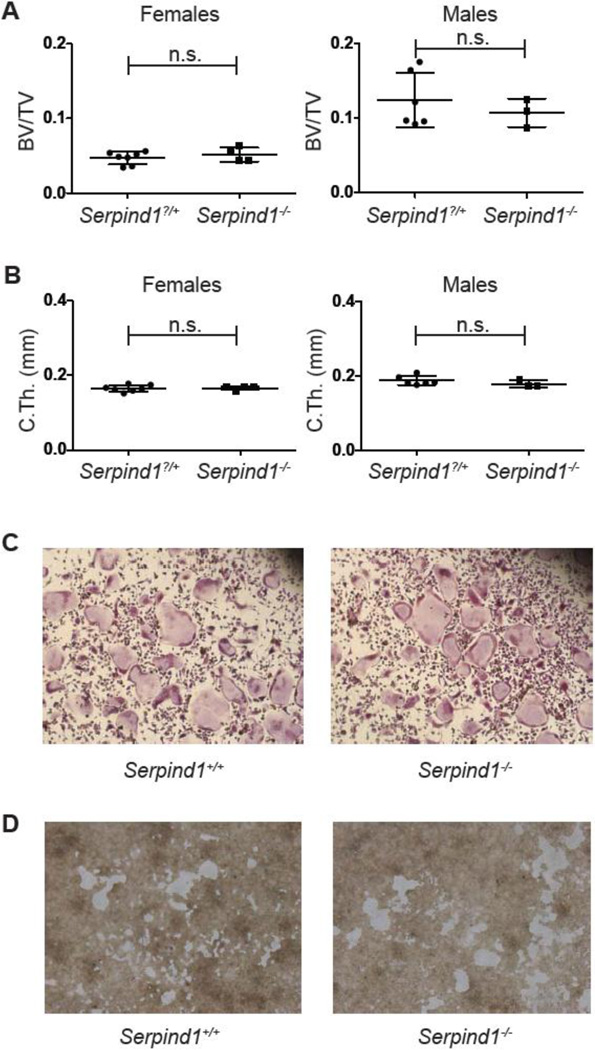
Fig. 3. Analysis of Serpind1−/− mice and osteoclasts.
(A, B) Micro-CT quantification of femoral (A) metaphyseal trabecular BV/TV and (B) midshaft cortical thickness of 12 week old female and male Serpind1?/+ (female, n=7; male, n=6) and Serpind1−/− (female, n=4; male, n=3) mice. (C) TRAP stain of Serpind1+/+ and Serpind1−/− osteoclast cultures. (D) resorption of calcium phosphate coated tissue culture wells incubated with Serpind1+/+ and Serpind1−/− osteoclasts. (n.s., not significant; **, p<0.01.)

