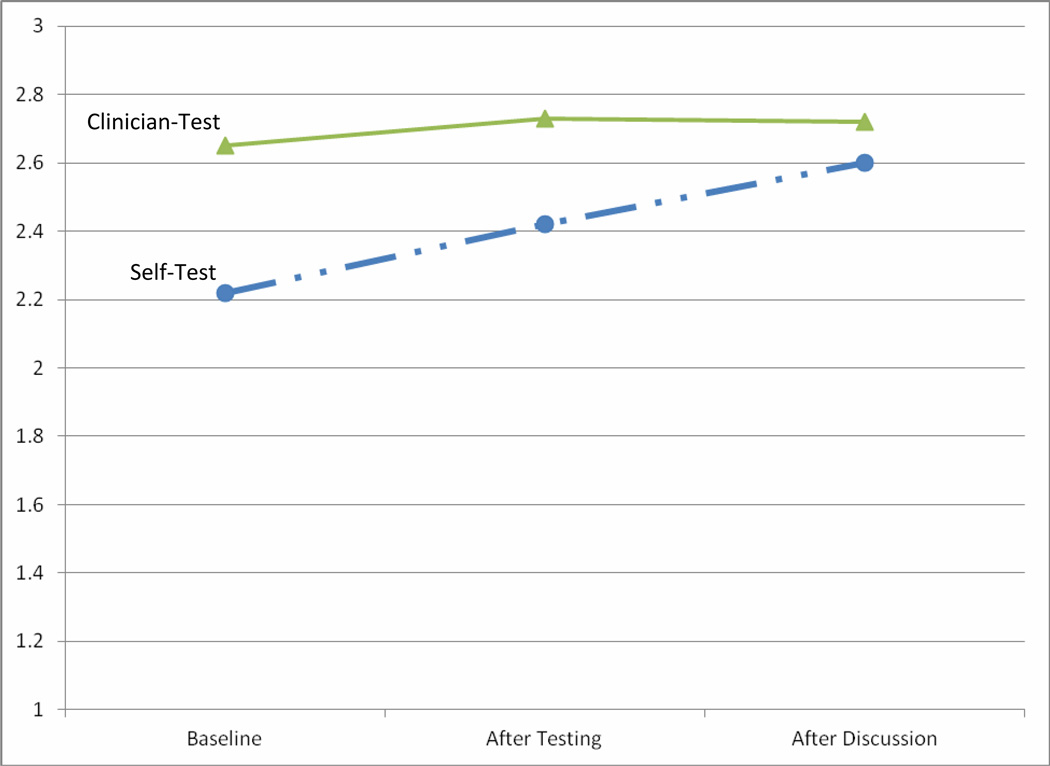
Figure 1.
Change in Trust of BV self-test compared to BV clinician-test over three time points The Y-axis represents the mean score of the two-item trust subscale (range 1–3). Time points are baseline (before testing), after self- and clinician-testing, and after a discussion of self- and clinician-test results. The trust of BV self-test results (dashed line) increased at both time points, whereas the trust of clinician BV test results (solid line) was high and did not change over time.

