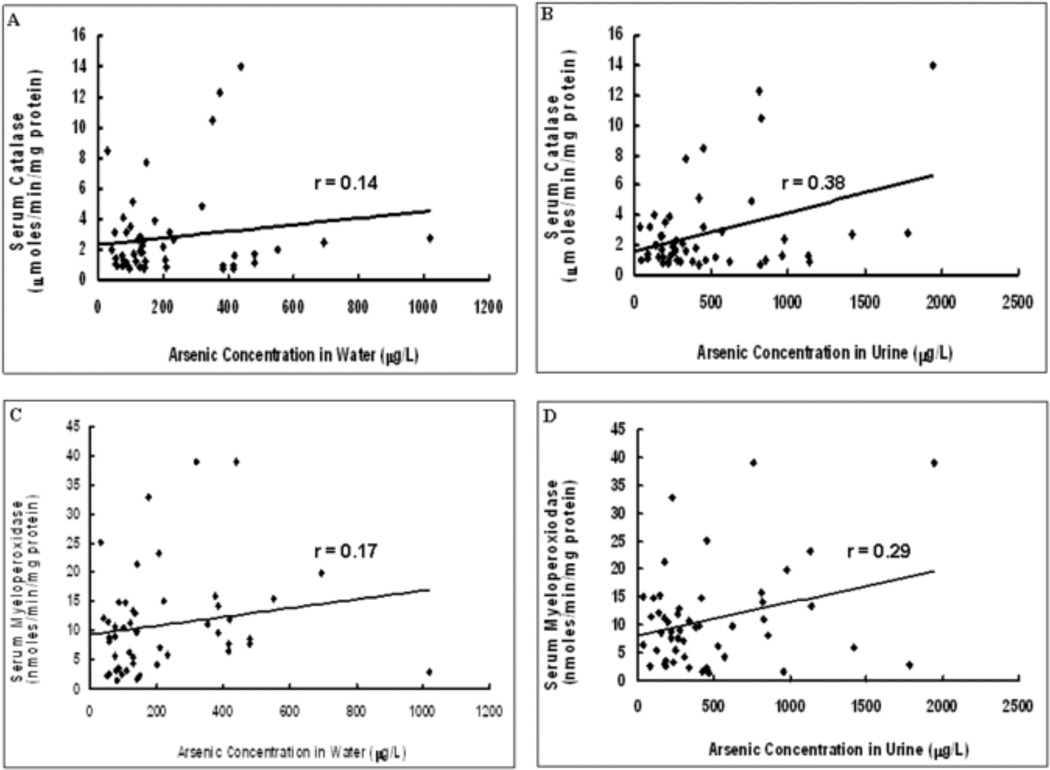
Fig.1.
Correlation between arsenic concentration in water and urine and specific activities of the enzymes studied. 1A. Graph showing scatter plot of arsenic concentration in water vs. specific activity of serum catalase. 1B. Graph showing scatter plot of arsenic concentration in urine vs. specific activity of serum catalase. 1C. Graph showing scatter plot of arsenic concentration in water vs. specific activity of serum myeloperoxidase. 1D. Graph showing scatter plot of arsenic concentration in urine vs. specific activity of serum myeloperoxidase. Trendline has been provided in each graph as also the value of the correlation coefficient (r).

