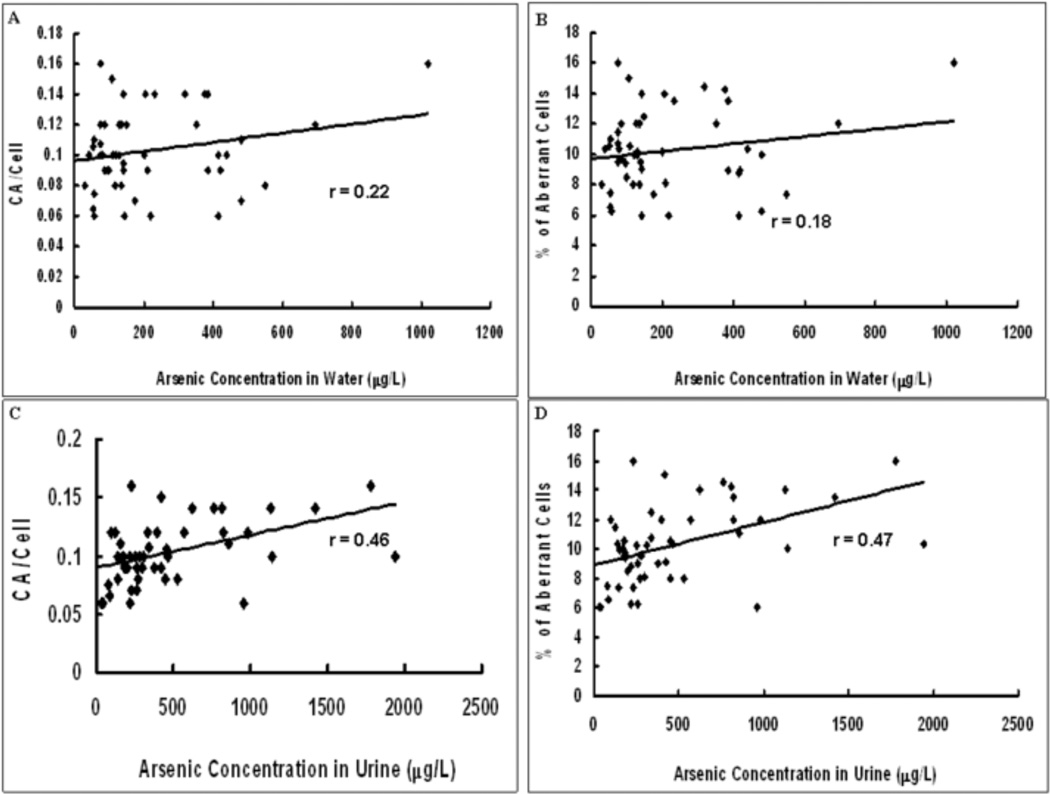
Fig.3.
Correlation between arsenic concentration in water and urine and induction of DNA damage. 3A. Graph showing scatter plot of arsenic concentration in water vs. CA/cell. 3B. Graph showing scatter plot of arsenic concentration in water vs. % of aberrant cells. 3C. Graph showing scatter plot of arsenic concentration in urine vs. CA/cell. 3D. Graph showing scatter plot of arsenic concentration in urine vs. % of aberrant cells. Trendline has been provided in each graph as also the value of the correlation coefficient (r).

