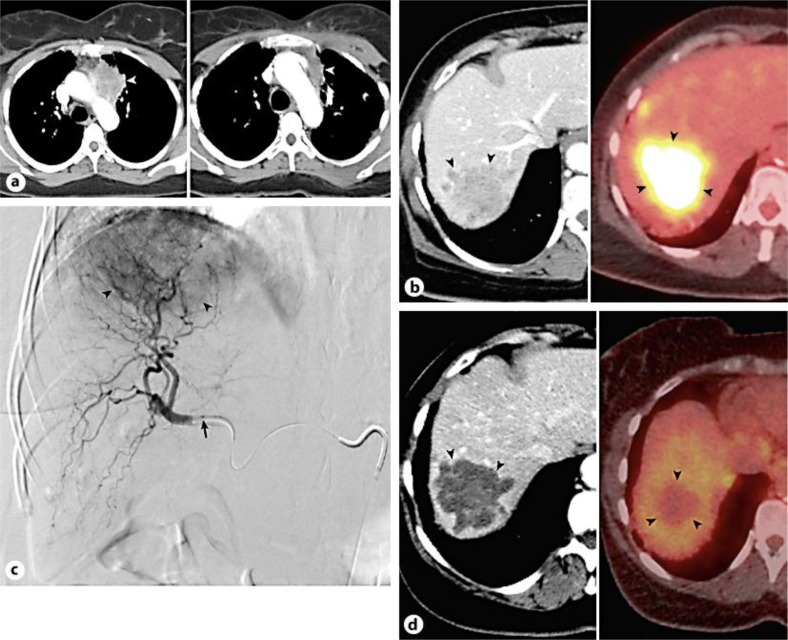
Fig. 1.
Baseline contrast-enhanced CT scan (left) reveals large left upper lobe lung mass (arrowhead). Post-chemotherapy CT scan (right) demonstrates significant tumor size reduction (arrowhead) (a). CT (left) and PET CT (right) images show large hypermetabolic liver metastasis (arrowheads) (b). Digital subtraction right hepatic arteriogram displays hypervascular metastasis (arrowheads); microcatheter tip denoted by arrow (c). CT (left) and PET CT (right) images after 90Y liver therapy reveal complete tumor response (arrowheads), evidenced by CT attenuation reduction indicating necrosis, as well as complete loss of PET avidity indicating lack of viable tumor (d).

