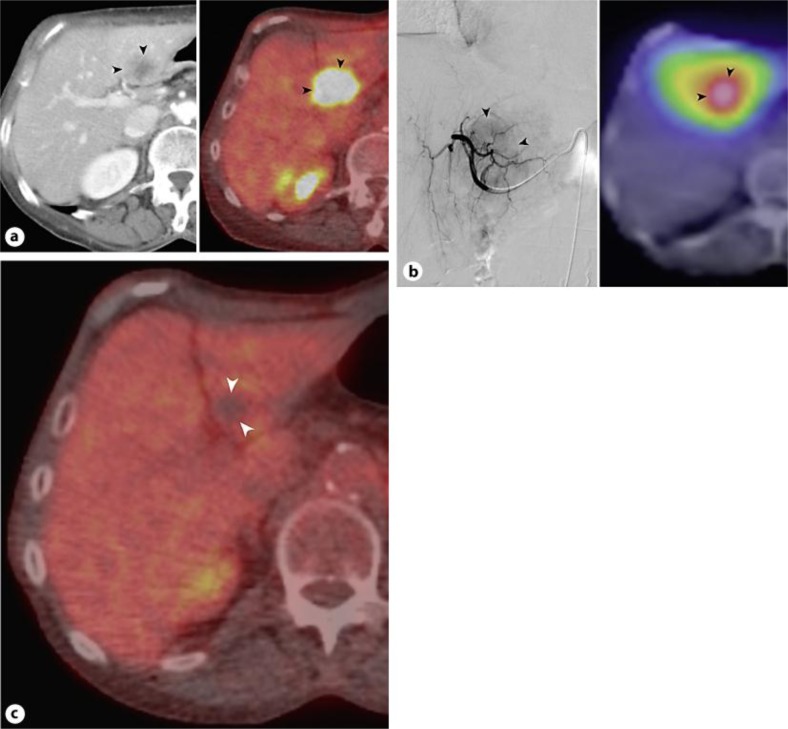
Fig. 2.
Contrast-enhanced CT (left) and PET CT (right) images show hypermetabolic liver metastasis (arrowheads) (a). Digital subtraction left hepatic arteriogram (left) displays hypervascular metastasis (arrowheads); bremsstrahlung scan (right) performed after radioembolization demonstrates targeted tumor uptake of 90Y (b). PET CT image after 90Y liver therapy reveals complete tumor response (arrowheads), evidenced by complete loss of PET avidity (c).

