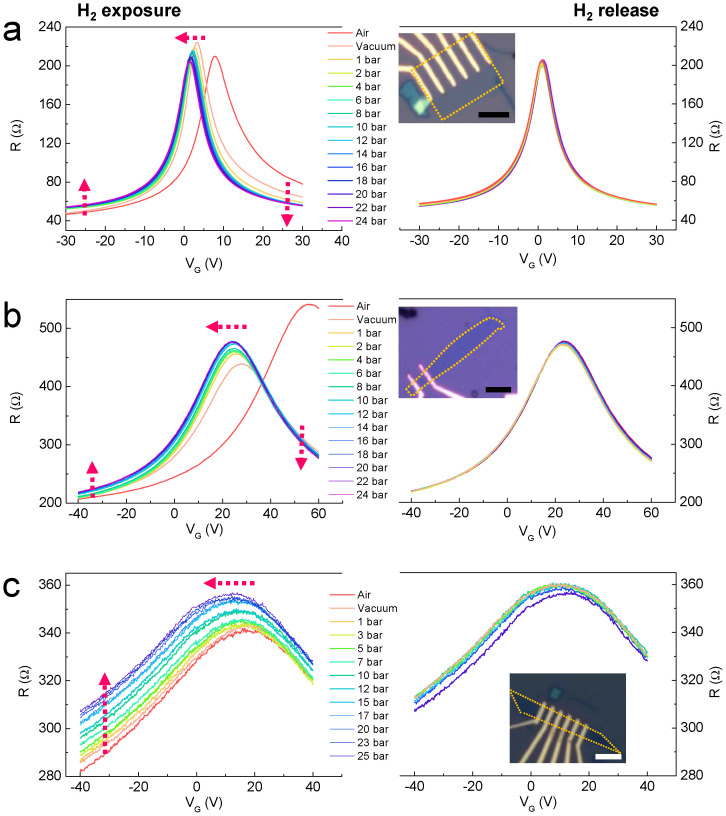
Figure 1. VG-dependent R as a function of H2 pressure for (a) SLG, (b) BLG, and (c) MLG.
At H2 pressure = 0 (vacuum), all graphene samples show the standard ambipolar field effect and the CNP broadens as the layer number increases. Upon H2 exposure (left panels), the CNPs of all graphene samples shift toward the negative VG region. The shift becomes larger with increasing layer number. In SLG, the maximum resistance, RM, decreases, but it increases in BLG and MLG. The decrease in RM may be a characteristic fingerprint of SLG. An increase and decrease in R for VG ≪ VCNP and for VG ≫ VCNP are observed in SLG and BLG. In the case of MLG, this behaviour may be observed over a wide-range VG sweep. During the release process (right panel), the same propensity is shown but is very small. The insets show optical microscopy images for each graphene sample. The scale bar is 5 μm.

