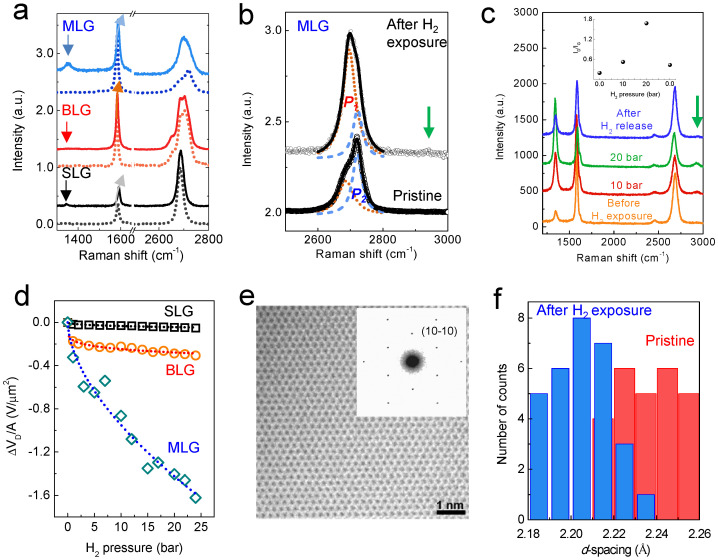
Figure 2. Dissociative H2 adsorption.
(a) Raman spectra for SLG, BLG, and MLG before (dotted line) and after H2 exposure. Broadening and a blueshift of the G band (sp2 carbon) occur, and the D band near 1350 cm-1 (sp3 carbon) develops due to H2 exposure. (b) A close view of the variation in the 2D band of MLG. The small peak at approximately 2930 cm−1 corresponds to the C-H bond (green arrow). (c) H2 pressure-dependent Raman spectroscopy of the CVD graphene. The defect evolution (ID/IG ratio) is depicted in the inset. Two zero values of H2 pressure are observed, one before H2 exposure (first one) and one after evacuation (left one). The peak for the C-H bond is clearly shown in the CVD graphene. (d) The variation in VCNP increases as the number of graphene layers increases. We chose VCNP at the highest pressure of 24 bar in this study with the assumption that hydrogen is almost saturated on and within the graphene at this pressure. (e) TEM image and ED patterns for graphene after H2 exposure. The carbon honeycomb lattice is clearly shown. (f) A histogram shows the d-spacings (10-10) for thirty different regions of graphene before (red) and after (blue) H2 exposure. The averaged d-spacings for pristine and hydrogen-chemisorbed graphenes are 2.22 ± 0.016 Å and 2.20 ± 0.014 Å, respectively.

