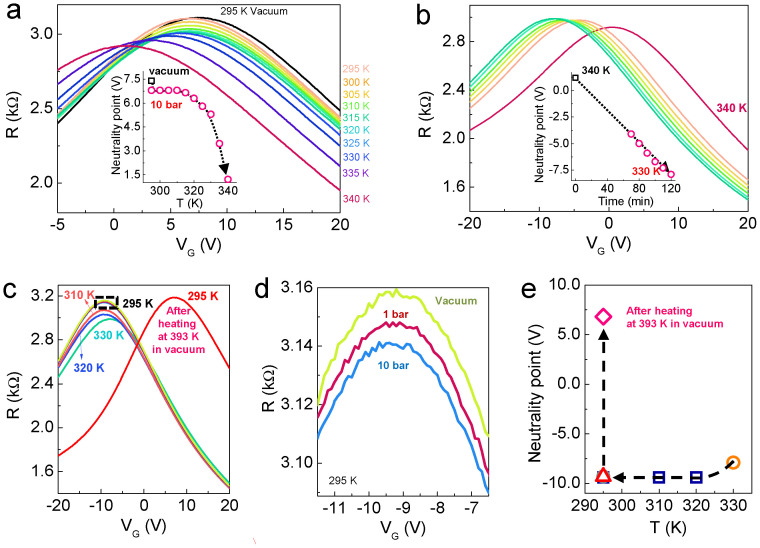
Figure 3. VG-dependent R as a function of temperature for MLG at 10 bar of H2 pressure.
MLG samples were used to clarify the n-doping effect. (a) Upon exposing the graphene to 10 bar of H2 at 295 K, the CNP shifts toward the negative VG region. As the temperature increases up to 310 K, the CNP remains nearly constant. In fact, it shifts but cannot be defined because of the resolution (a VG sweep interval of 50 mV). Beyond 315 K, the CNP shifts again, and the variation in CNP increases with temperature up to 340 K. (b) During the cooling process, we set the temperature to 330 K. As the exposure time increases, the CNP continuously shifts along the same direction and RM increases slightly. The insets of (a) and (b) clearly show the variation in the CNP. (c) The shift is maintained down to 320 K but not below 310 K. (d) At 295 K, although the H2 pressure is released, no shift in the CNP is observed. (e) The variation in the CNP during the release process is depicted.

