Figure 6.
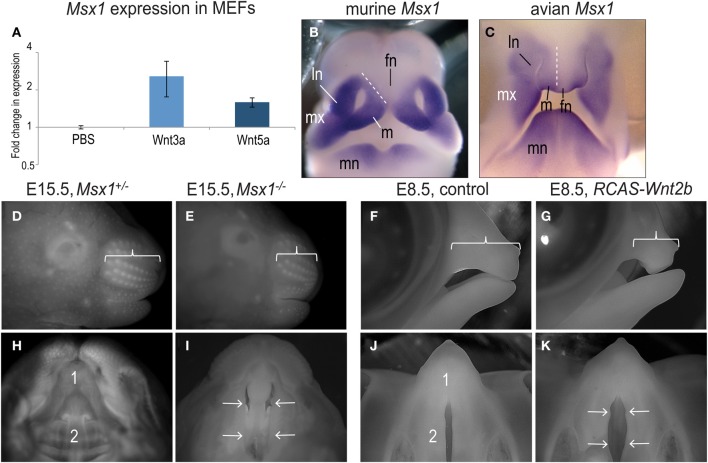
Loss and gain of Msx1 expression leads to a similar clefting phenotype. (A) Msx1 gene expression induced by Wnt3a or Wnt5a treatment in E11.5 MEFs. (B) Comparison between in situ hybridization of Msx1 in mice and (C) chick embryos. (D) Lateral view of E15.5 Msx1+/− and (E) Msx1−/− embryos. Bracket indicates the length of the rostrum. (F) Lateral view of control and (G) RCAS-Wnt2b treated E8.5 chicken embryos. Bracket indicates the length of the upper beak. (H) Ventral view of E15.5 Msx1+/− and (I) Msx1−/− embryos. Primary (1) and secondary (2) palates are fused in Msx1+/− embryos but the secondary palate is cleft in Msx1−/− embryos (arrows). (J) Ventral view of control and (K) RCAS:Wnt2b treated E8.5 chicken embryos. Primary (1) palate is fused while secondary (2) palate is naturally cleft in control embryos; note widening of secondary palate secondary to ectopic Msx1 expression (arrows). fn, frontonasal prominence; ln, lateral nasal prominence; m, medial nasal prominence; mn, mandibular prominence; mx, maxillary prominence.

