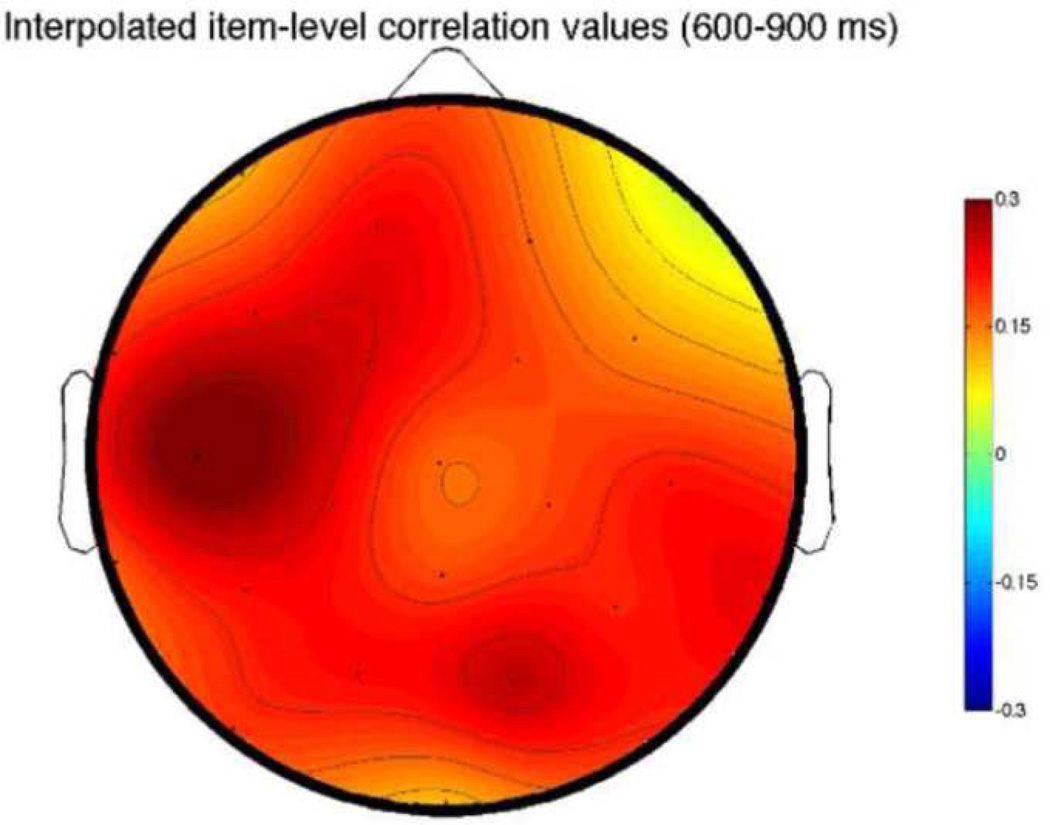
Figure 4.
Topographic map of correlation coefficients for the items analysis of mean amplitudes in the 600–900 ms timewindow and number of alternative completions for each sentence, within the moderately constraining range (75–90%). Like the scalp distribution of the overall ERP effect, the correlation map shows a left-frontal focus.

