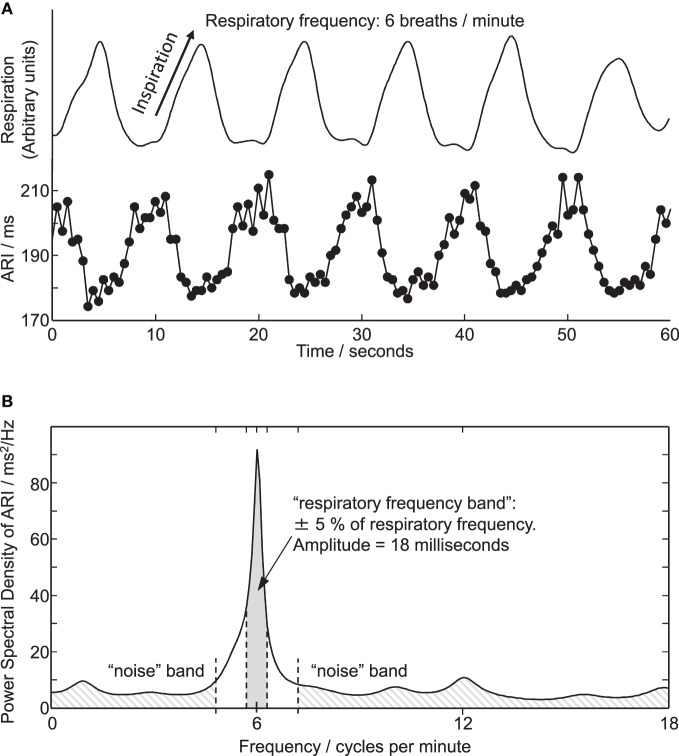
Figure 3.
(A) Respiration and simultaneous ARI measures from an electrode site on LV endocardium showing cyclic variation at the respiratory frequency of 6 breaths/min. (B) Power spectral density (PSD) plot of the ARI measure computed over the entire 6 breaths/min recording. Peak in ARI oscillation coincides with respiratory frequency of 6 breaths/min. Shaded areas illustrate frequency bands used for calculating amplitude and statistical significance of oscillations, see “Methods” section.

