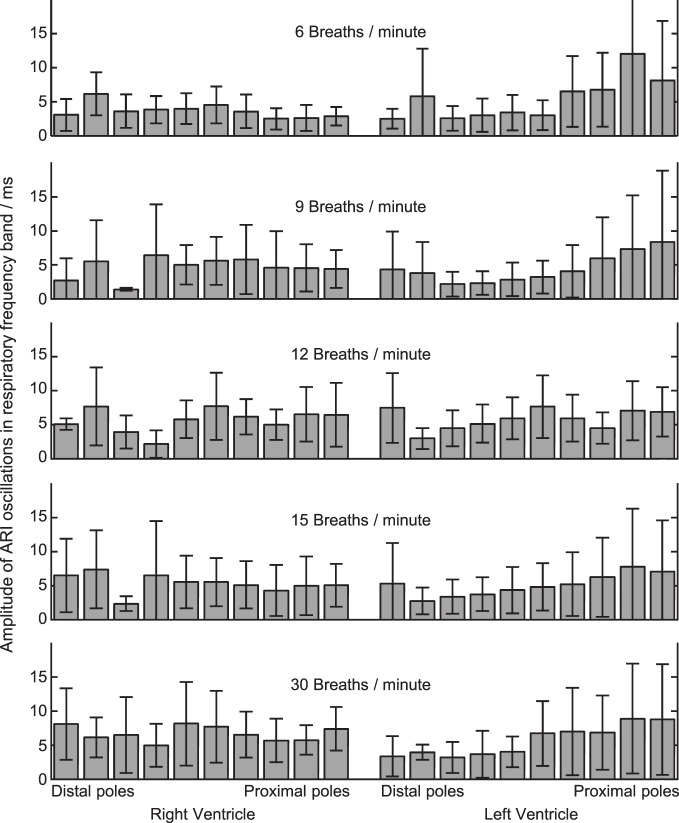
Figure 4.
Amplitude of ARI oscillations during constant-rate breathing at each of five rates (top to bottom). Amplitude was calculated within the respiratory frequency band in each case, see “Methods” section and Figure 3. At each respiratory rate, ARI oscillation was measured at 20 local recording sites on the left and right ventricular myocardium. 16 subjects studied: mean ± standard deviation shown.

