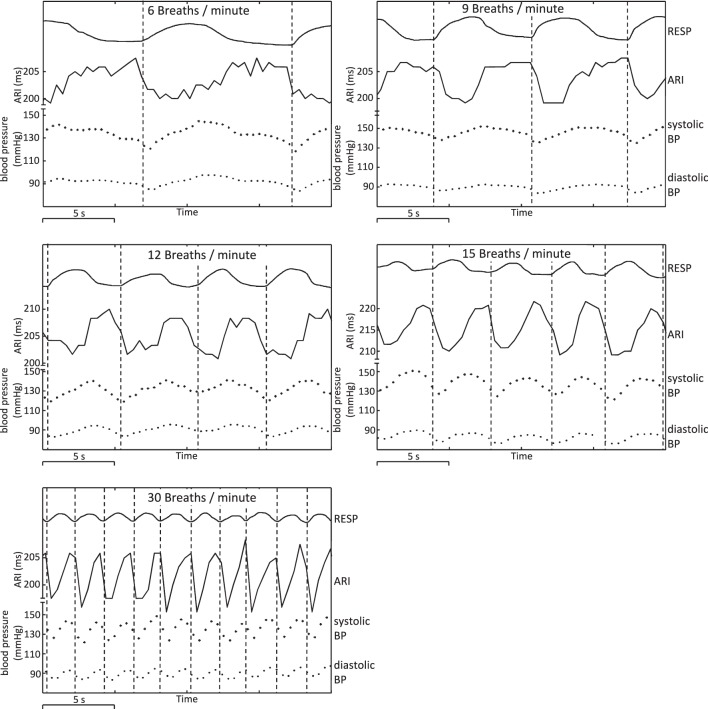
Figure 5.
Example plots showing respiration, ARI, and arterial blood pressure at respiratory frequencies of 6, 9, 12, 15, and 30 breaths/min, illustrating cyclical variation. Arterial BP: systolic peak values and diastolic troughs for each heart beat are shown as individual points. Vertical lines have been added at the times of onset of inspiration to illustrate chronological (phase) relationships.

