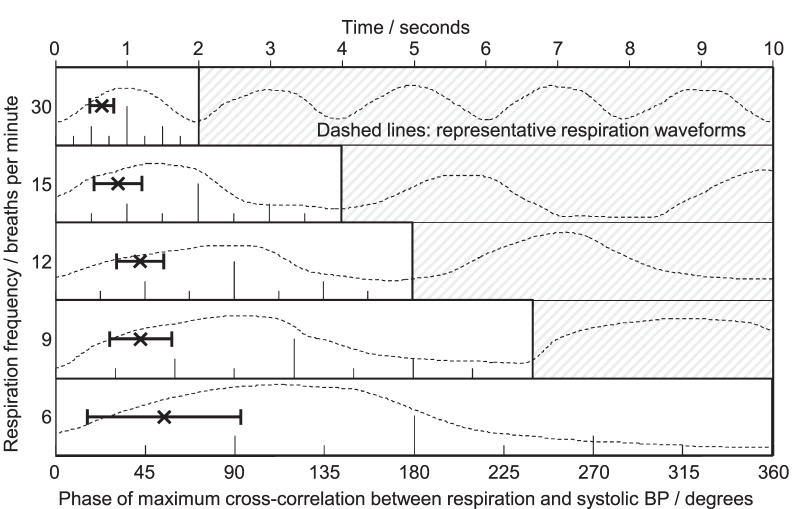
Figure 6.
Phase relationships obtained from cross-correlation between respiration and systolic blood pressure. Five respiration frequencies are presented (top to bottom) on a common horizontal time axis; typical respiration waveforms are plotted against time as a guide. At each rate, one full respiratory cycle is marked in degrees (0–360°). Each plot shows the mean ± SD lag for all subjects, readable as absolute lag in seconds (top scale) or relative lag in degrees of one full cycle (individual scales). BP fluctuations lagged behind respiration at all respiratory rates. The mean lag decreased slightly in absolute terms from 1.5 s at the slowest rate of 6 breaths per min to 0.65 s at the fastest rate of 30 breaths per min. As proportions of the respiratory cycle, the lags increased from 55 to 116°, respectively.

