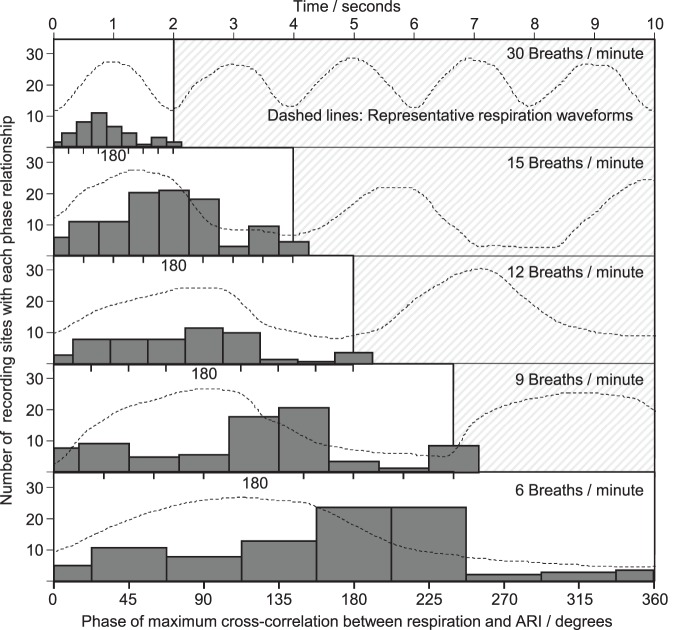
Figure 7.
Phase relationships obtained from cross-correlation between respiration and ARI. As with Figure 6, a common horizontal time axis is used, and typical respiratory waveforms are shown, with one cycle highlighted. At each respiratory rate, one cycle is divided into 9 ranges (with 0 and 360° shown separately) and a histogram collates the phase lags computed at each electrical recording site within each subject. The height of each bar represents the total number of electrical recording sites with a maximum cross-correlation lag falling within that phase of the cycle. The most frequently occurring phase lags were clustered around 180° between respiration and ARI.

