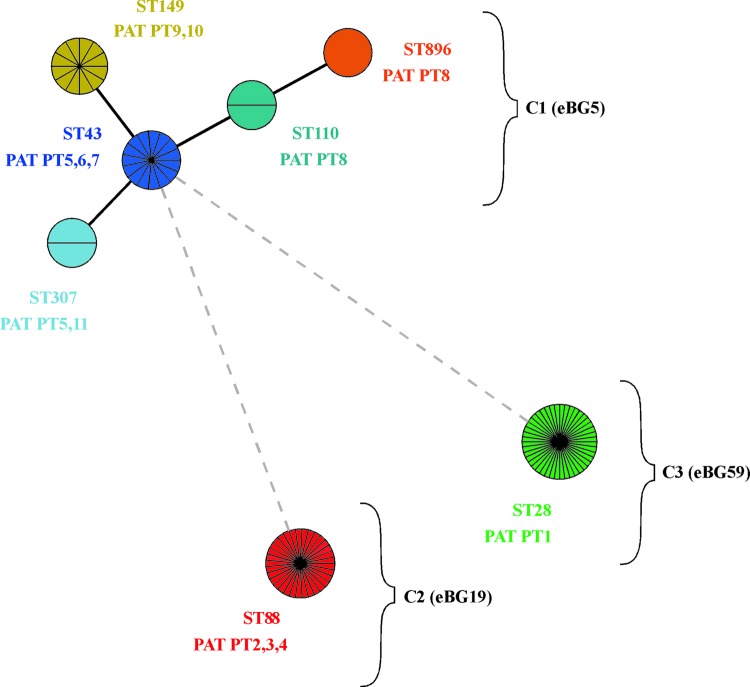
Fig 2.
Minimal spanning tree of MLST data on 108 S. enterica serovar Paratyphi B (dT+) isolates. Each circle refers to one ST subdivided into one pie slice per strain. STs that share six identical gene alleles are linked by a black line, and STs sharing only one or no common gene allele are linked by a gray dotted line. Based on their similarity, STs were grouped in three complexes (C1, C2, and C3). According to the nomenclature of Achtman et al. (1), C1 is designated eBG5, C2 is eBG19, and C3 is eBG59. Pathogenicity array types (PATs) found in each ST are shown below ST designations.

