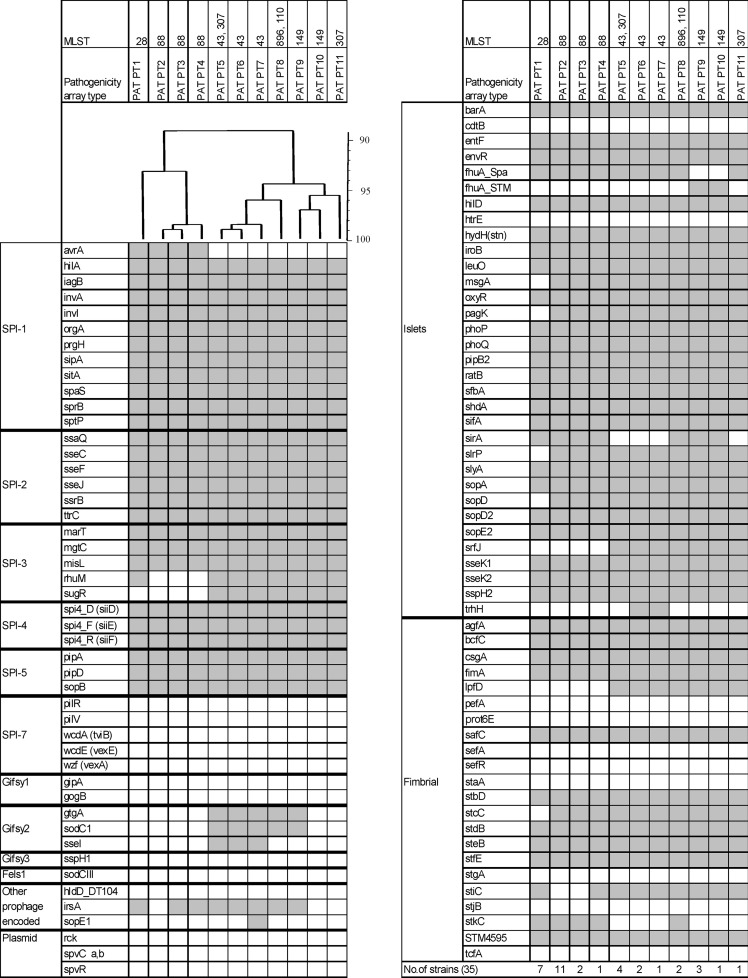
Fig 4.
Virulence determinants of 35 S. enterica serovar Paratyphi B (dT+) strains analyzed. On the left side the analyzed genes are indicated and grouped according to their particular genomic location (SPI-1 to SPI-7; prophages Gifsy-1, Gifsy-2, Gifsy-3 and Fels-1; plasmids; and islets) or function (fimbrial). At the top, assigned PATs and corresponding STs are indicated. Immediately below this, an UPGMA dendrogram shows the similarity of PATs in percentages. The hybridization result of each PAT is shown by column. A white box indicates the absence, and a gray box indicates the presence of the target sequence.

