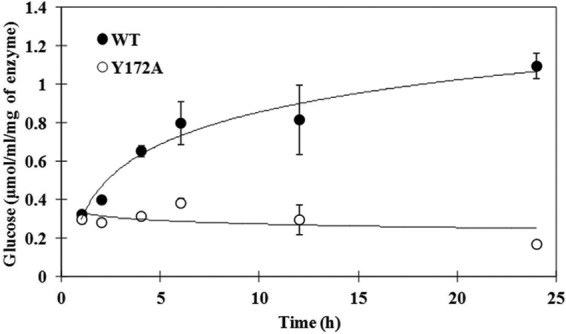
Fig 2.

Time course of LR-CD hydrolysis reaction by WT and Y172A CgAMs at 30°C and pH 6.0 determined by glucose release. The reaction conditions are described in the “Assay of amylomaltase” section of Materials and Methods. Data are shown as the mean ± SD and are derived from 3 independent experiments.
