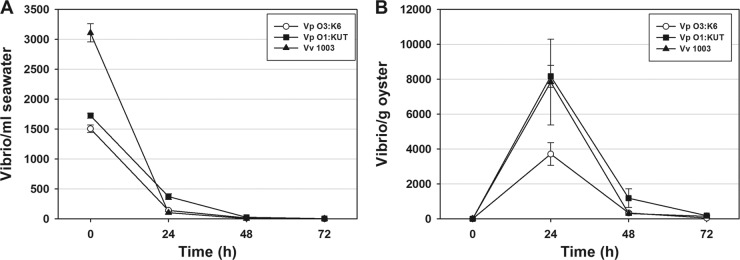
Fig 2.
Comparison of the levels of V. parahaemolyticus (Vp) O3:K6, V. parahaemolyticus (Vp) O1:KUT, and V. vulnificus VV1003 (Vv 1003) in seawater (A) and oysters (B) over 72 h. The error bars in panel A indicate the SEM of three independent experiments with three subsamplings per time point with assays performed in triplicate (n = 27), while the error bars in panel B indicate the SEM of three independent experiments each performed in triplicate (n = 9).

