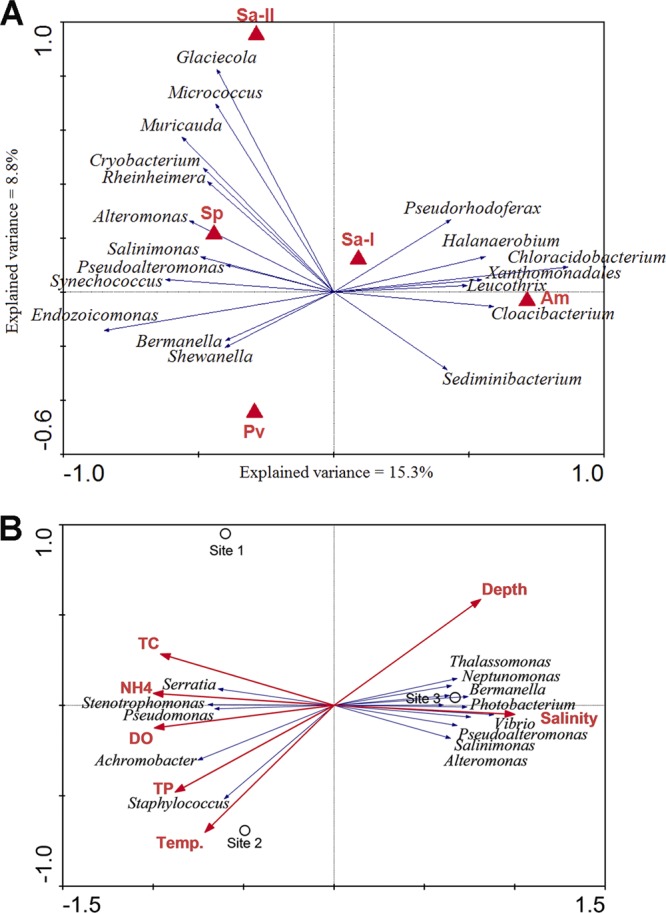
Fig 6.

RDA ordination plots showing the relationships of coral-associated bacteria with coral species and environmental parameters at different sites. (A) Biplot showing the relationship between coral species and bacterial genus compositions. See Table 1 for sample identifiers. (B) Triplot showing the relationship between environmental parameters, sampling sites, and bacterial genus compositions. Correlations between environmental variables and the first two RDA axes are represented by the lengths and angles of the arrows (environmental-factor vectors). Automatic forward selection with Monte Carlo permutation tests was applied to build the parsimonious model, which included temperature (Temp.), salinity, depth, TC, ammonium (NH4), and TP, explaining the variance in the bacterial communities. The environmental variables were checked to minimize colinearity in the analyses.
