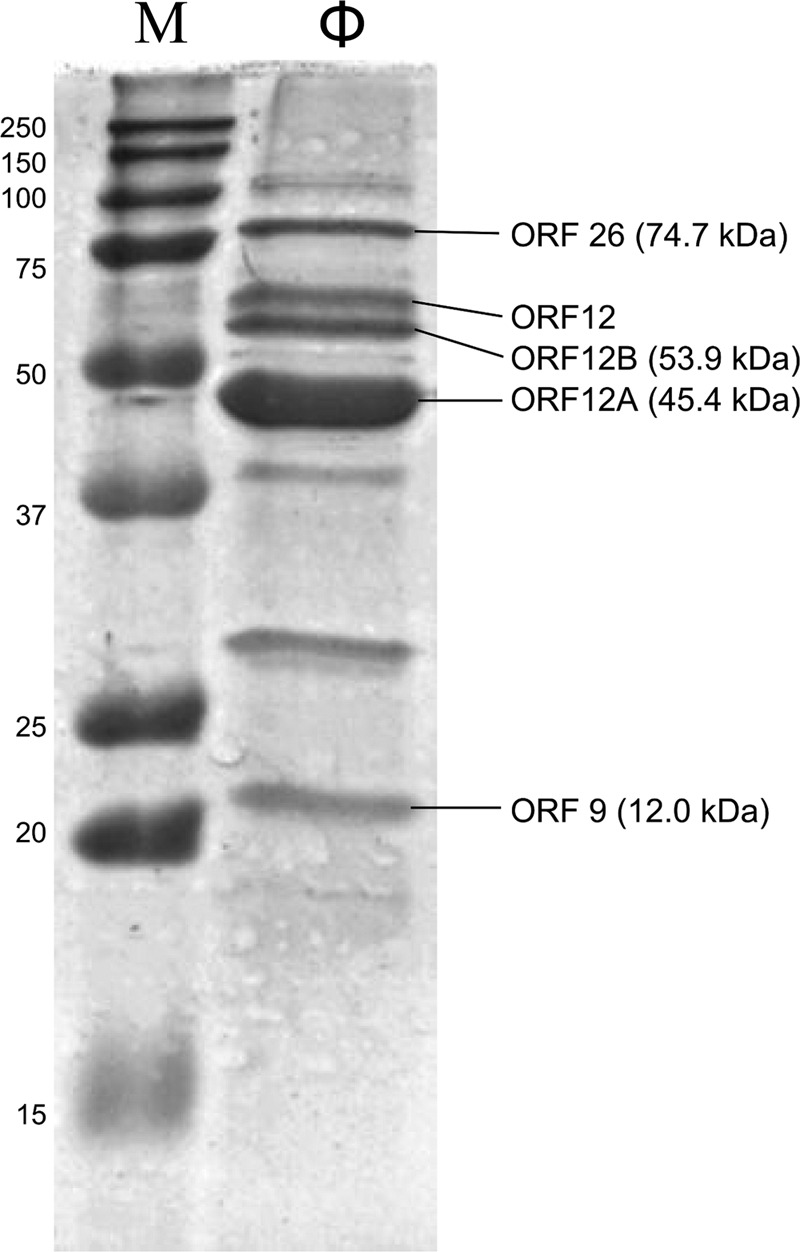
Fig 4.

SDS-PAGE analysis of ϕYS61 structural proteins. Lane M, molecular mass marker, with masses in kilodaltons indicated on the left; lane ϕ, ϕYS61 proteins visualized with Coomassie stain. Protein identities determined by MS analysis are shown on the right side with deduced molecular masses shown in parentheses. No molecular mass could be predicted for the protein band marked ORF12 since we were unable to identify the mechanism by which a protein of this size is produced from the coding sequence of orf12A or orf12B.
