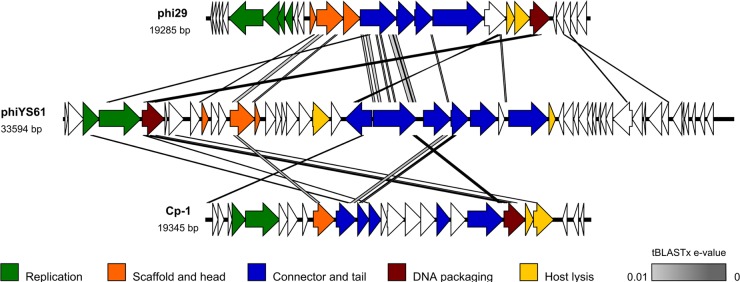
Fig 5.
Genome comparison of ϕYS61 and its two closest relatives, Bacillus phage ϕ29 (NC_011048) and Streptococcus phage Cp-1 (NC_001825). Genes are indicated by arrows and colored according to gene function, as indicated. Comparisons were done by tBLASTx, and similarities with E values lower than 0.01 were plotted as gray lines. Darker gray fills indicate lower E values, as shown below the figure.

