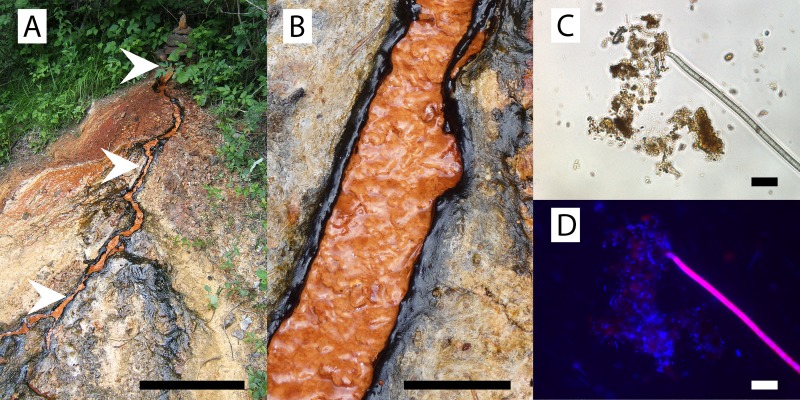
Fig 1.
Photographs and light microscopy images of Fuschna Spring. (A) Overview. Arrowheads, sampling locations. Bar, 1 m. (B) Closeup of the stream with cyanobacterial mats and minerals precipitates about 1.2 m downstream from the spring outlet. Bar, 5 cm. (C) Representative light microscopy image of a sample from the cyanobacterial mat 1.2 m downstream from the spring outlet. Bar, 25 μm. (D) Epifluorescence microscopy image of panel C. DAPI-stained signal (blue) overlaid with the autofluorescence signal of cyanobacteria (pink).

