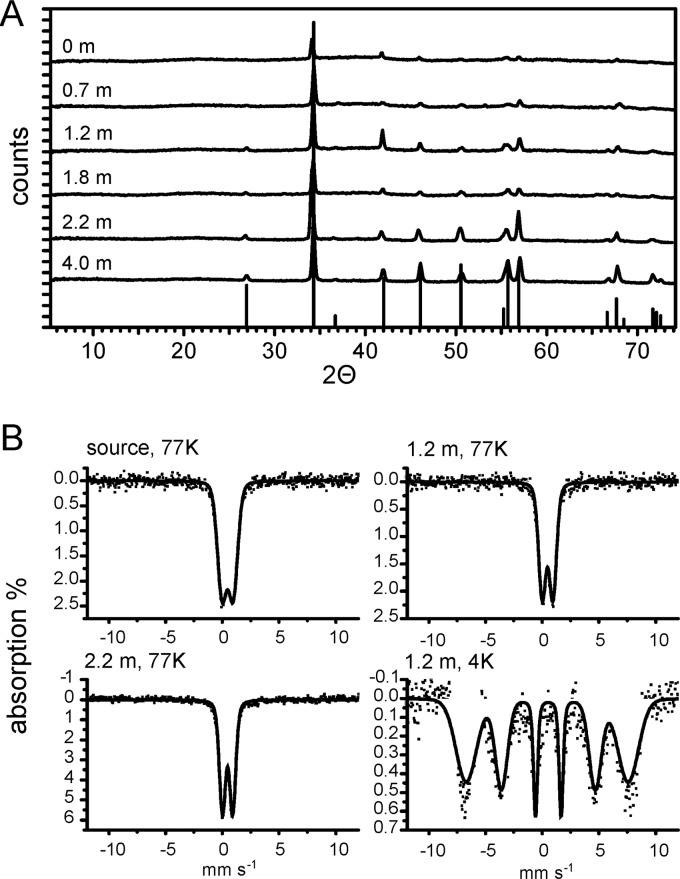
Fig 3.
(A) Representative X-ray diffractograms of mineral samples collected downstream of the spring outlet. At the bottom, the reference for calcite is shown (powder diffraction file 00-005-0586). The samples were collected in August 2009. (B) Mössbauer spectra measured at 77 K from samples collected in August 2009 at three different distances from the spring outlet. For the sample collected at 1.2 m downstream, an additional spectrum was collected at 4 K. Red lines, fitted model results. For Mössbauer parameters, see Table S2 in the supplemental material.

