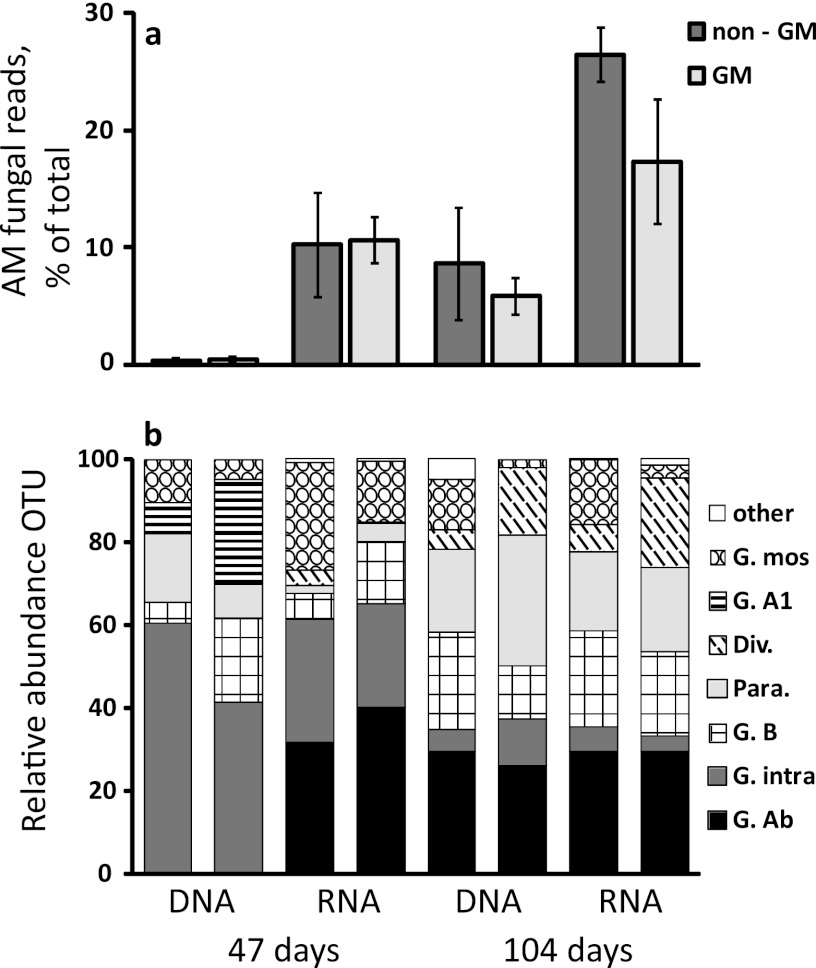
Fig 2.
(a) The total number of sequences derived from AM fungi is shown as a percentage of total fungal reads (mean ± SE). At both samplings, AM fungi were highly overrepresented in RNA compared to in DNA, and both increased from the first to the second sampling date. The relative abundances of AM fungi to total fungi were similar between GM and non-GM plants. (b) The mean relative abundance of each OTU (left and right bars of each panel representing non-GM and GM plants, respectively) also did not differ between GM and non-GM plants at any of the two time points or nucleic acid type (RNA or DNA; P > 0.05 for each OTU). For both panels, each column is represented by n = 5, except for GM at 104 days (both DNA and RNA) (n = 6) and non-GM at 104 days (both DNA and RNA) (n = 4).

