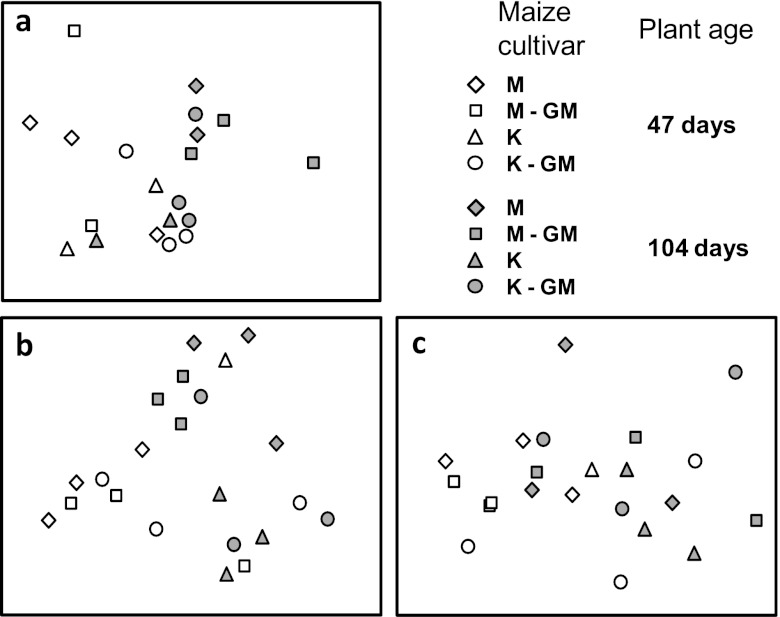
Fig 3.
NMDS biplots of Bray-Curtis similarities among communities found in the experimental treatments using pyrosequencing for RNA (stress = 0.14; n = 20 total samples) (a) and T-RFLP for RNA (stress = 0.16; n = 22) (b) and DNA (stress = 0.14; n = 22) (c). Note that for T-RFLP, two samples have been excluded; see the supplemental material for plots with these samples included.

