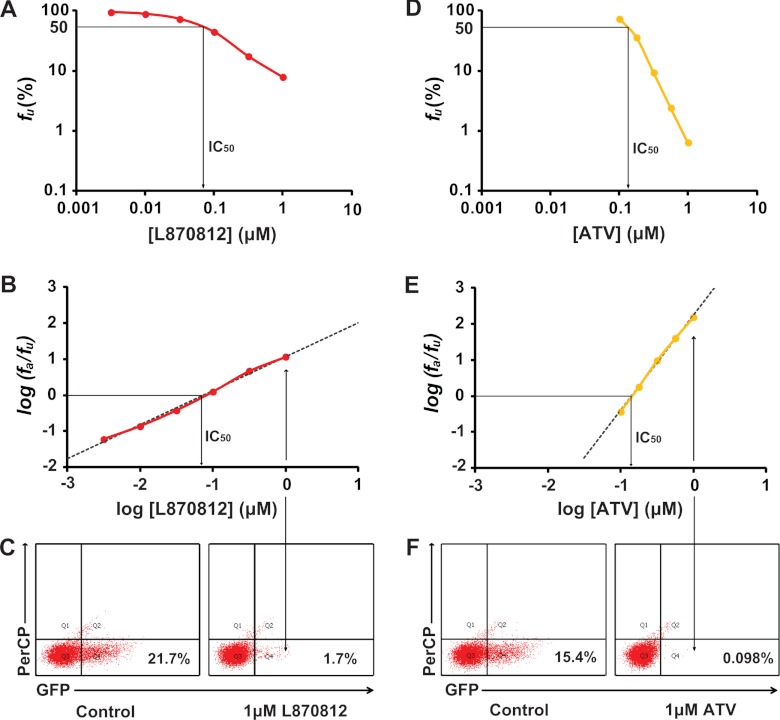
Fig 2.
Measurement of IC50 and m using single-round infectivity assay. (A) Log-log dose-response curve for the integrase inhibitor L870812. Each point represents the mean from more than three experiments. The IC50 of L870812 is shown by the arrow. (B) Linearized dose-response curve for L870812 based on median effect model. The IC50 of L870812 is shown by the arrow. (C) Representative flow cytometry plots showing detection of cells that were infected in the absence (left) or presence (right) of 1 μM L870812. (D) Log-log dose-response curve for the protease inhibitor ATV. Each point represents the mean from more than three experiments. The IC50 of ATV is shown by the arrow. (E) Linearized dose-response curve for ATV based on median effect model. The IC50 of ATV is shown by the arrow. (F) Representative flow cytometry plots showing detection of cells that were infected with virions generated in the absence (left) or presence (right) of 1 μM ATV.

