Fig 5.
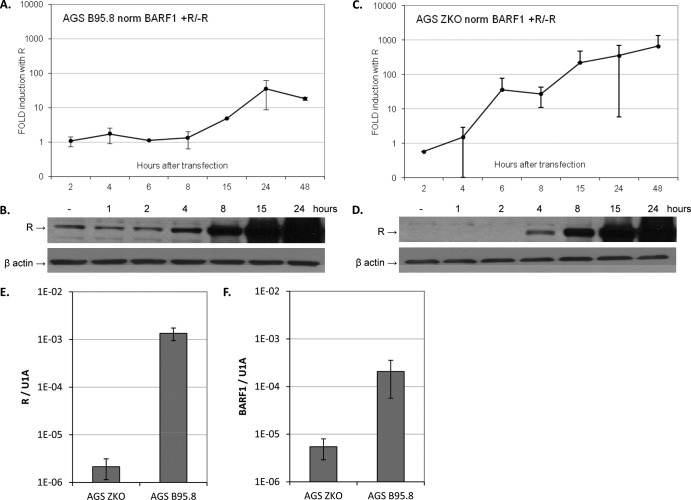
R transactivates BARF1 mRNA with early kinetics. (A) AGS B95.8 cells were transfected with R expression vector or empty vector. Cells were collected at different time points after transfection, and RNA was isolated and converted to cDNA using gene-specific primers. Quantitative RT-PCR was performed, and BARF1 values were normalized to U1A. The graph represents the fold induction of BARF1 mRNA by R (data represent averages of the results of two experiments). (B) SDS-PAGE Western blot analysis of R expression levels in AGS B95.8 cells after transfection with empty vector (−) and at various time points after transfection with R expression vector. (C) AGS ZKO cells were transfected with R expression vector or empty vector, and RT-PCR was performed on samples harvested at various time points as described for panel A. Values of fold induction of BARF1 mRNA by R, representing averages of the results of three experiments, are shown. (D) SDS-PAGE Western blot analysis of R expression levels in AGS ZKO cells after transfection with empty vector (−) and at various time points after transfection with R expression vector. R protein was detectable 6 h after transfection. (E) R mRNA levels indicated a 630-fold difference in R baseline expression between AGS ZKO and AGS B95.8 cells. (F) BARF1 mRNA levels indicated a 38-fold difference in BARF1 baseline expression between AGS ZKO and AGS B95.8 cells.

