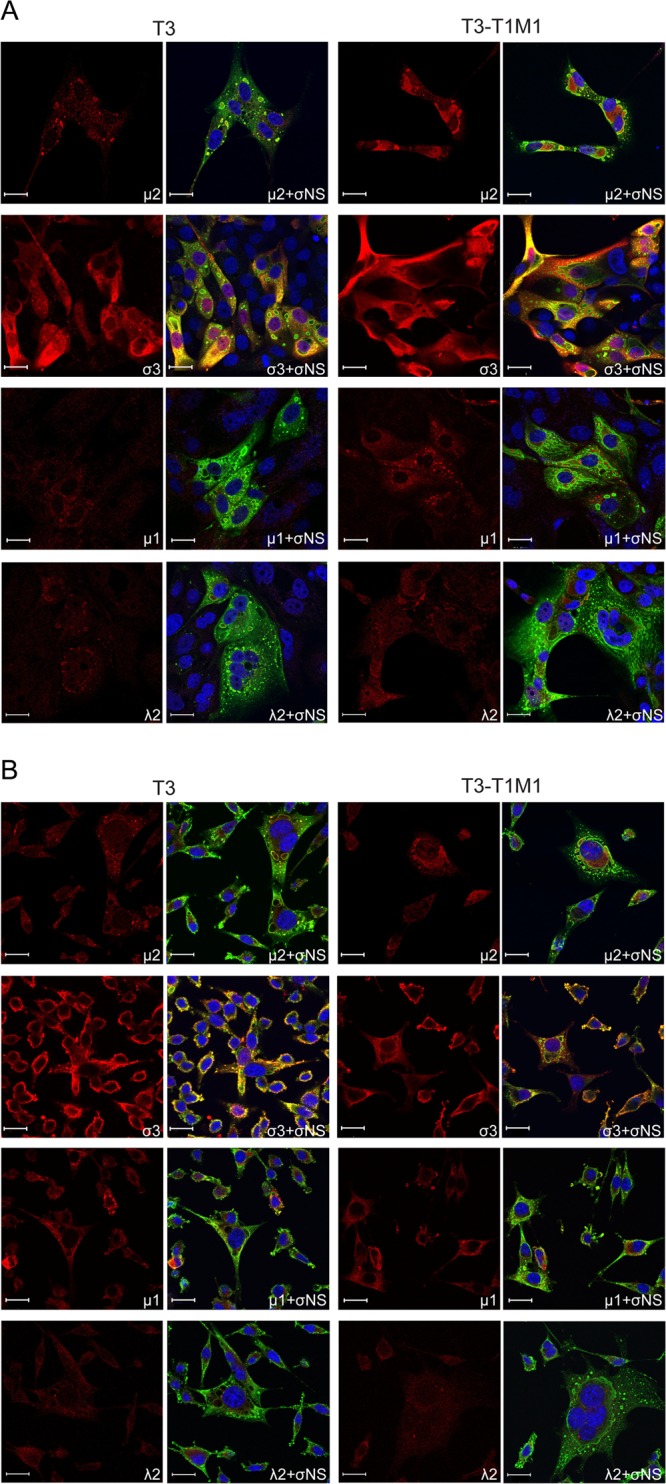
Fig 2.

Distribution of reovirus proteins μ2, σ3, μ1, and λ2 in infected cells. MDCK cells (A) and L929 cells (B) were absorbed with either T3 or T3-T1M1 at an MOI of 20 PFU/cell, fixed at 24 h postinfection, stained with anti-σNS (green) and anti-μ2, anti-σ3, anti-μ1, or anti-λ2 (red) antibodies. Nuclei were visualized using ToPro3 (blue). Images were captured using confocal microscopy. Scale bar, 20 μm.
