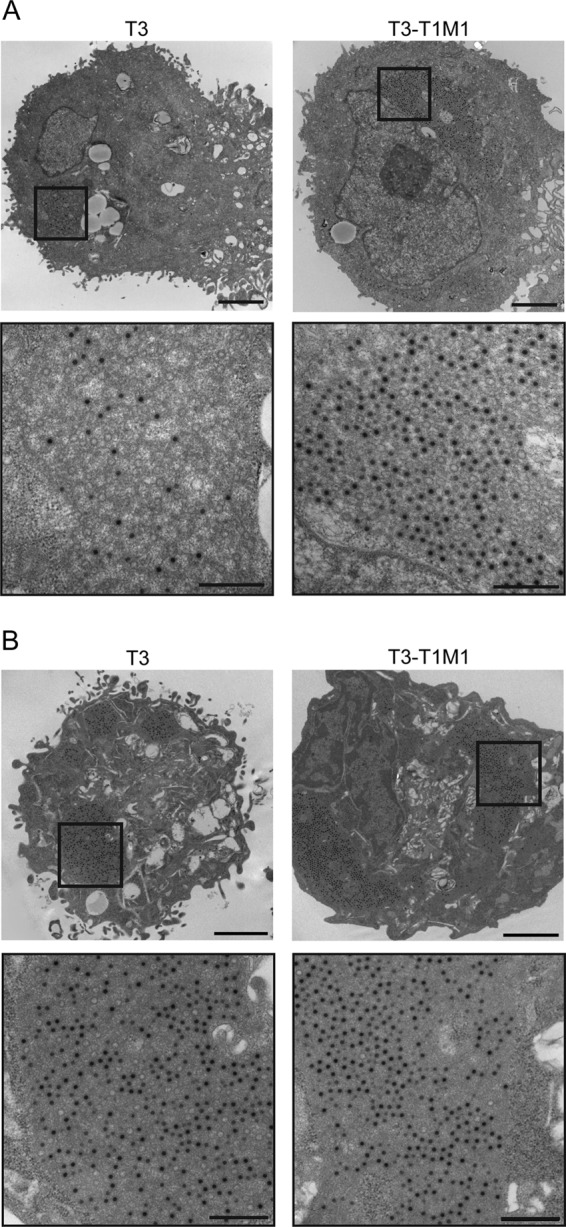
Fig 3.

Ultrastructural analysis of viral inclusions. MDCK cells (A) and L929 cells (B) were adsorbed with either T3 or T3-T1M1 at an MOI of 100 PFU/cell and fixed at 24 h postinfection. Ultrathin sections (65 to 70 nm) were examined using transmission electron microscopy. Boxed regions correspond to high-magnification images shown below. Scale bars, 2 μm (low-magnification images) and 500 nm (high-magnification images).
