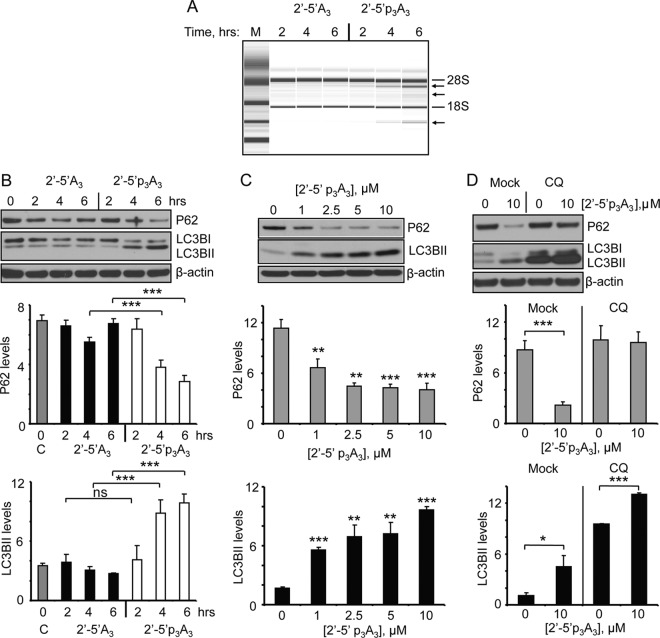
Fig 3.
Direct activation of RNase L by 2-5A induces autophagy in Hey1b cells. (A) Cells were treated with 10 μM inactive 2-5A (2′-5′A3) or active 2-5A trimer (2′-5′ p3A3) for the indicated times, and rRNA cleavage was observed in RNA chips. M, RNA ladder markers (Agilent). (B) Cells were treated with 10 μM 2′-5′A3 or 2′-5′p3A3 for the indicated times, and induction of autophagy was monitored by visualizing P62 and LC3BII levels in immunoblots (top). Average levels of P62 and LC3BII are shown normalized to β-actin levels (middle and bottom). (C) Cells were transfected with the indicated concentrations of 2′-5′p3A3 for 6 h and P62, LC3BII and β-actin levels were measured from immunoblots as in panel B. (D) Immunoblots for P62, LC3B, and β-actin from Hey1b cells treated with chloroquine (CQ) beginning 2 h prior to mock transfection or transfection with 2′-5′p3A3 and continuing for an additional 6 h, analyzed as for panel B. Graphs were constructed by using three independent biological replicates. Error bars (SD) and P values determined by two-tailed Student's t test (*, P < 0.05; **, P < 0.01; ***, P < 0.001) are shown. C, control with transfection reagent only.

