Fig 4.
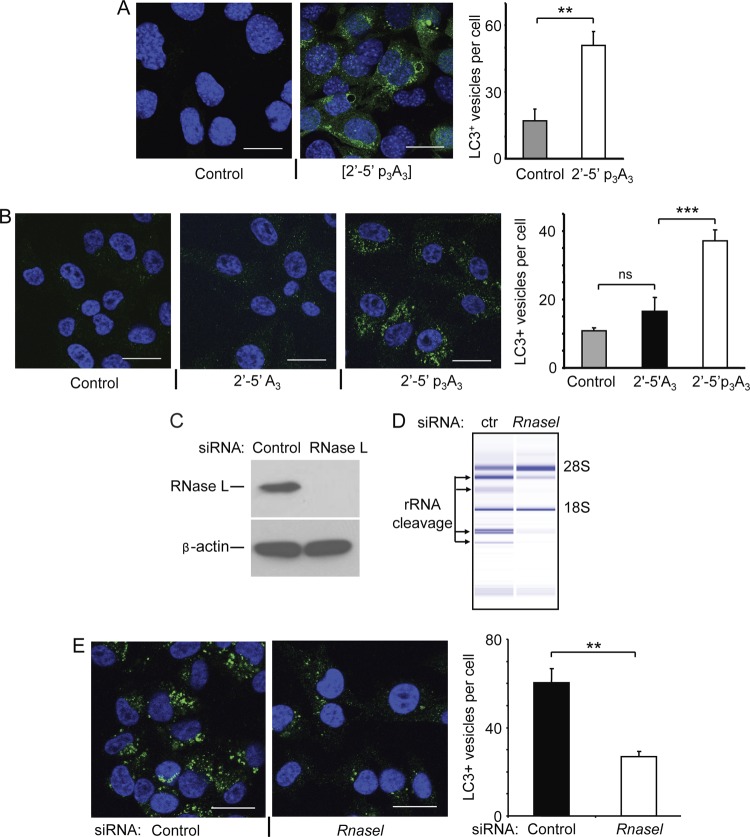
2-5A treatment results in a punctate structure characteristic of autophagy. (A) MEF expressing GFP-LC3 were either mock transfected (control) or treated with 2′-5′p3A3 (10 μM) for 6 h as indicated. Cells were fixed, nuclei were stained with DAPI (blue), and the GFP-LC3 punctate structures were visualized under confocal microscope at a magnification of ×63. Average numbers of LC3-positive vesicles per cell were quantified by analyzing control and 2-5A-treated cells from three biological replicates. (B) Hey1b cells were either mock transfected (control) or transfected with 10 μM inactive 2-5A [2′-5′A3] or active 2-5A trimer [2′-5′ p3A3] for 6 h as indicated. Cells were fixed and immunostained with antibody specific to LC3B (green), and the nuclei were stained with DAPI (blue) and visualized under a confocal microscope at a ×63 magnification. The numbers of LC3-positive vesicles per cell are averages from three biological replicates. (C) RNase L levels determined by immunoblotting in Hey1b cells treated with siRNA against Rnasel or control siRNA. (D) RNase L activity by rRNA cleavage assays was determined in control or siRNA-treated Hey1b cells transfected with 10 μM 2′-5′p3A3 for 6 h. (E) Hey1b cells treated as for panel D were fixed and immunostained with LC3B antibody (green), and nuclei were stained with DAPI (blue) and visualized with a confocal microscope at a ×63 magnification. Average numbers of LC3-positive vesicles per cell were quantified from three biological replicates. Error bars (SD) and P values determined by two-tailed Student's t test (**, P < 0.01; ***, P < 0.001; ns, not significant) are shown. Bars, 25 μm.

