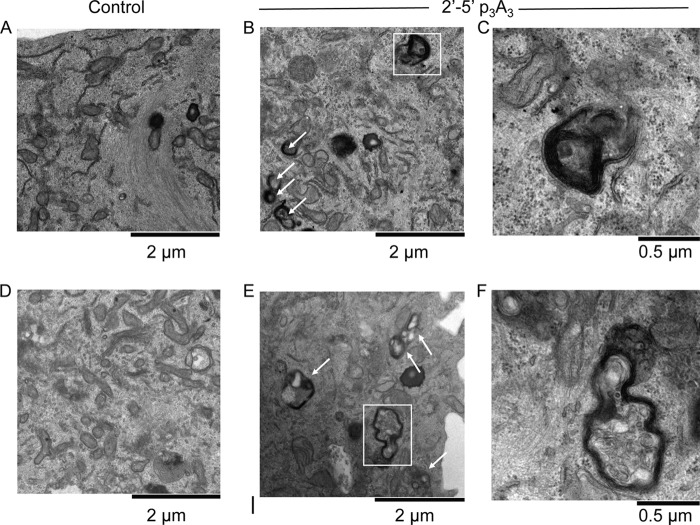
Fig 5.
Electron micrographs showing autophagosomes and autolysosomes in 2-5A-treated Hey1b cells. (A and D) Mock-transfected controls; (B and E) 2′-5′p3A3-treated cells after 6 h (magnification, ×22,000). (C and F) Representative autolysosome (C) and autophagosome (F) from 2′-5′p3A3-treated cells from panels B and E, respectively (magnification, ×66,000). Arrows show autophagosomes.

