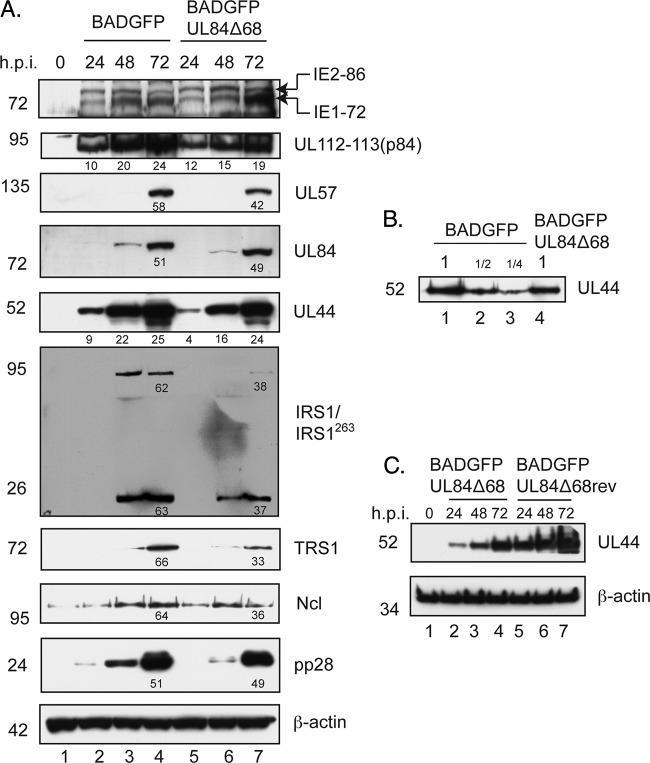
Fig 5.
Levels of viral and cellular proteins in infected cells. (A and C) Western blotting of infected cell lysate. HFF cells were infected at an MOI of 1 with the indicated viruses, and cell lysates were prepared for Western blotting at the indicated time points (indicated above the figure). (B) Determination of relative protein levels in cells. A 2-fold dilution series of protein from lane 2 of panel A (lanes 1 to 3) was analyzed by Western blotting using antibodies recognizing UL44 compared to undiluted protein from lane 5 of panel A. Proteins recognized by the antibodies used in each experiment are indicated to the right of each figure. The positions of molecular mass markers (kDa) are indicated to the left of each figure. In some panels the numbers below bands represent the percent adjusted volume of the signal from the particular bands measured within that panel using Quantity One software.

