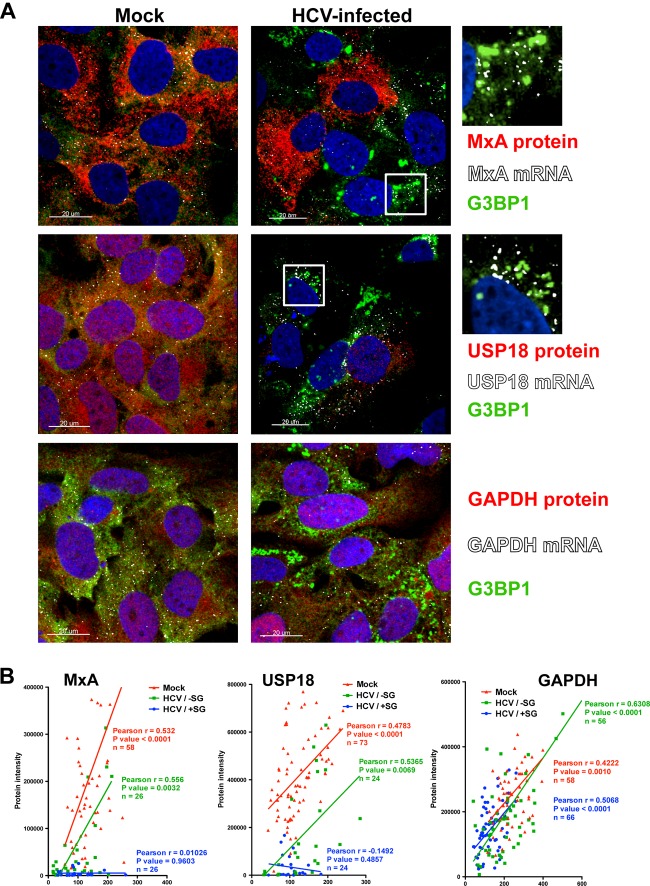
Fig 4.
Interferon-stimulated protein expression is suppressed in stress granule-positive HCV-infected cells. Huh-7 cells were infected (HCV-infected) or not (Mock) with JFH-1 D183 virus at a high multiplicity of infection (MOI = 5). Forty-eight hours later, the cells were treated or not with 1,000 U/ml of IFN-β for 7 h. (A) Visualization of MxA (upper panels), USP18 (middle panels), and GAPDH (lower panels) mRNAs (white dots) and the corresponding proteins (in red) as well as G3BP1 protein (in green) by fluorescence in situ hybridization (FISH) and conventional immunofluorescence after IFN treatment of HCV-infected and uninfected control (Mock) cells. Images displayed are of single 0.3-μm z-sections taken in a confocal microscope at a magnification of ×40. Nuclei are displayed in blue. Pictures on the very right are enlargements of the boxed areas showing a partial localization of MxA or USP18 mRNAs in stress granules. (B) Single-cell quantitation analysis of the number of MxA (left graph), USP18 (middle graph), and GAPDH (right graph) mRNA dots and the corresponding protein intensity per cell in samples that were treated with IFN as described above. Three data sets are displayed in each graph: in red, uninfected cells; in green, stress granule-negative HCV-infected cells; and in blue, stress granule-positive HCV-infected cells. Each data point in the graphs represents a single cell. Pearson correlation coefficients (r), their P values, and the number of cells analyzed (n) are displayed for each data set. The results displayed are representative of 2 (USP18 and GAPDH) or 3 (MxA) independent experiments.

