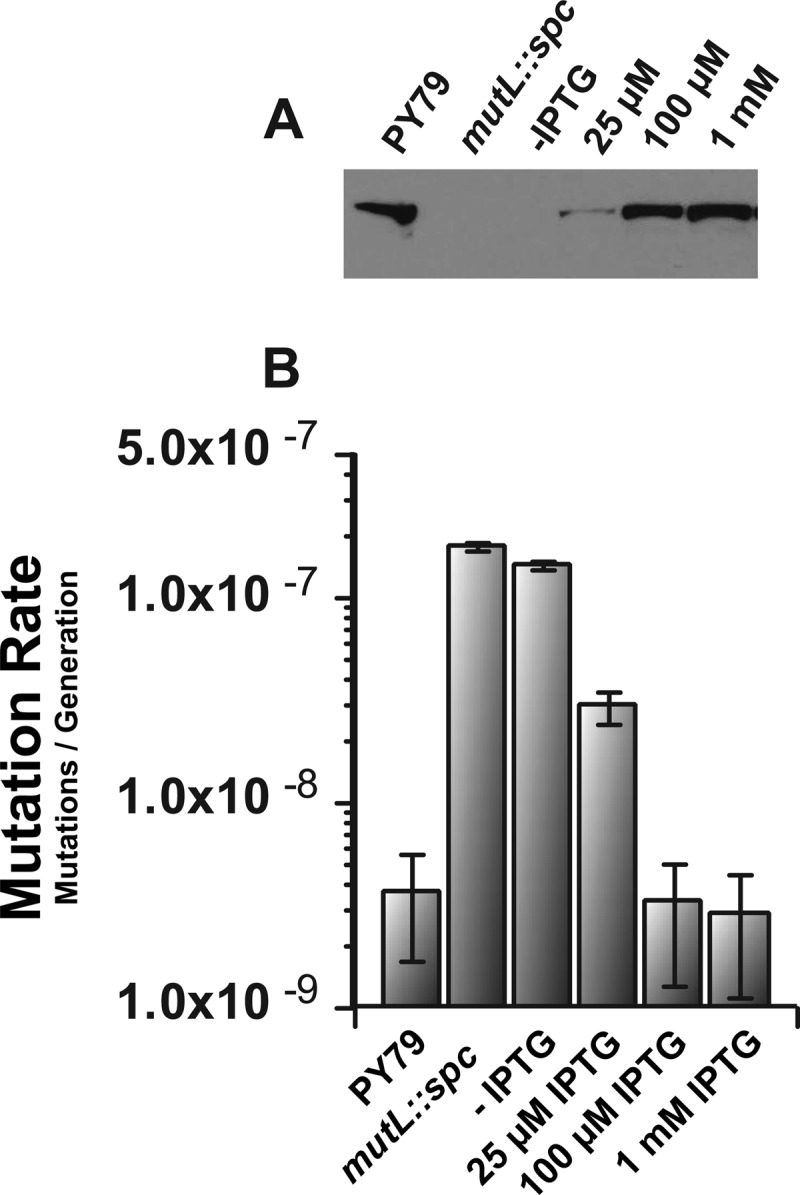
Fig 2.

Ectopic MutL expression. (A) The levels of MutL protein (left to right) from the wild-type control strain PY79, a strain with the mutL::spc allele, and samples with mutL expressed from amyE with the native mutL gene disrupted (mutL::spc) with the indicated concentrations of IPTG are shown. All samples were derived from cell extracts prepared as described in Materials and Methods. The sample load was normalized to total protein in each extract. (B) The mutation rate corresponding to each concentration of IPTG used in panel A is shown. Error bars represent the 95% confidence interval.
