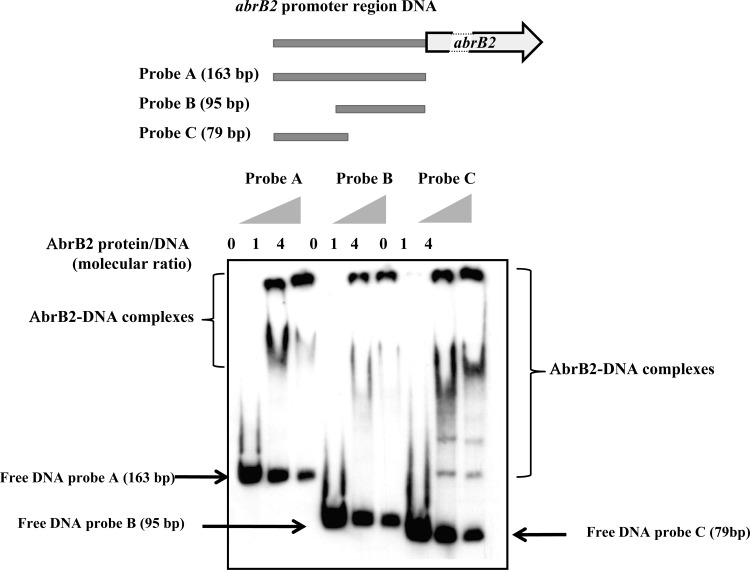
Fig 2.
Electrophoretic migration shift assay of binding of the AbrB2 regulator to the promoter region of its own gene. (Top) Schematic representation of the abrB2 gene, showing its 163-bp promoter region (gray line) and its protein-coding sequence (boxed arrows), which is interrupted (dashed lines) for the sake of size limitation. The positions and sizes of the three DNA fragments of the abrB2 promoter region used as targets for AbrB2 binding are indicated as probes A, B, and C. (Bottom) Analysis of the electrophoretic mobility of the DIG-labeled segments of the abrB2 promoter region, following incubation with increasing amounts of purified 6×His-AbrB2 protein. Arrows and regions delineated by braces indicate the positions of the free DNA probes and the retarded DNA-protein complexes, respectively.

