Fig 3.
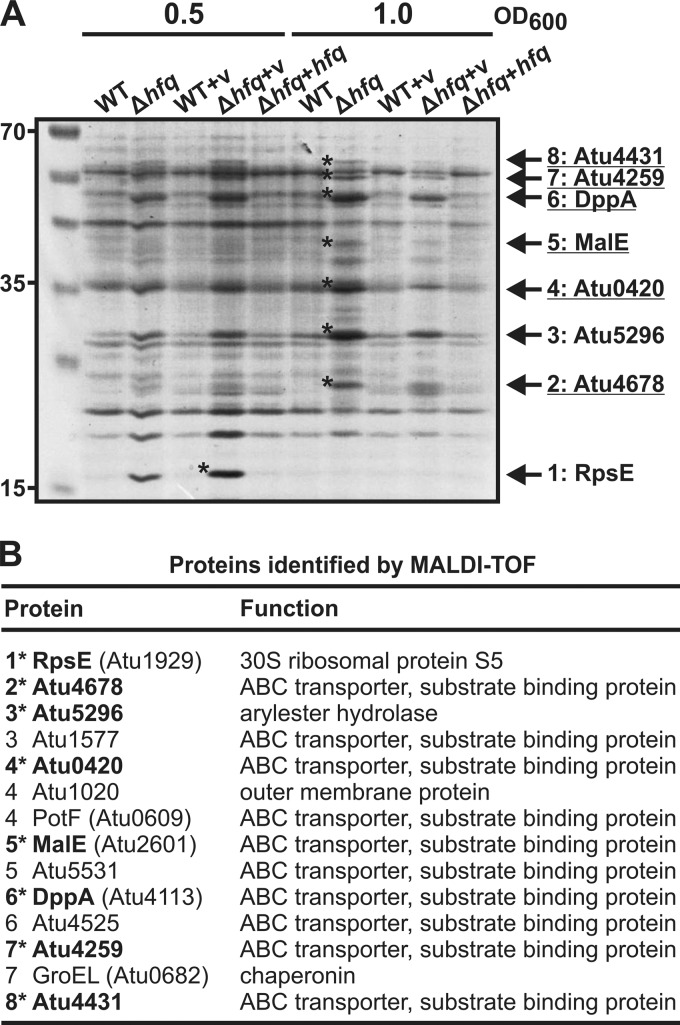
Altered protein levels in the hfq deletion mutant. (A) Total protein samples from different growth phases (indicated above the gels) of A. tumefaciens wild type (WT), the Δhfq strain, the complemented mutant (Δhfq+hfq), and control strains containing the empty vector (v) (WT+v and Δhfq+v) were loaded on a 12% SDS–PAGE gel. The positions of marker proteins are given on the left in kDa. Eight prominent protein bands accumulating in the mutant were analyzed via MALDI-TOF. The proteins identified with the highest confidence are given on the right. ABC transporter components are underlined. (B) Identification of overexpressed proteins (A) in the Δhfq mutant by MALDI-TOF. Proteins that were ranked at the first position after MALDI-TOF analysis are in boldface and marked by asterisks. All other listed proteins were additionally identified during mass spectrometry.

