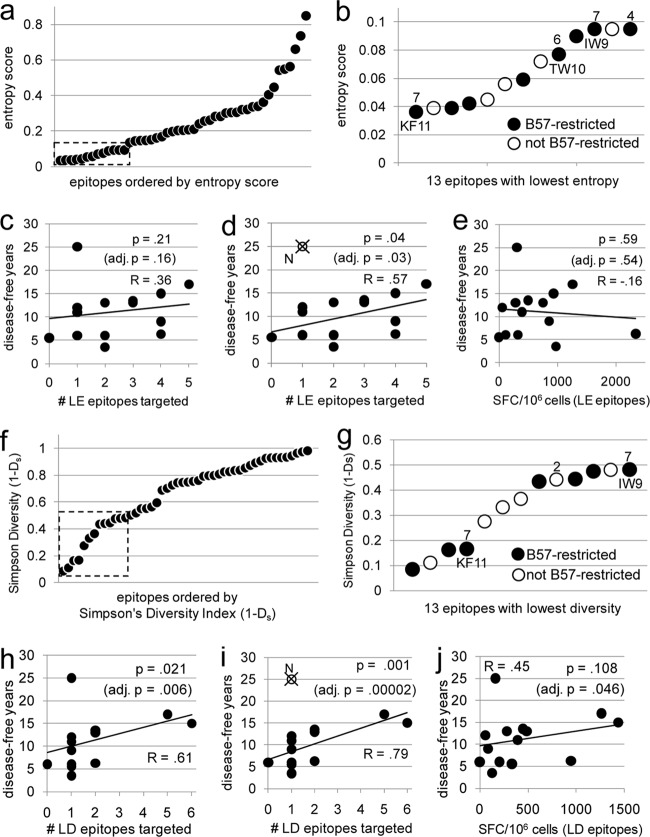
Fig 2.
Greater targeting of conserved epitopes early in infection correlates with longer times until disease. The 47 epitopes/peptides targeted by participants in this study were plotted by Shannon entropy score (a) and Simpson's diversity index (f). Low scores indicate greater sequence conservation. (a) The 13 epitopes with entropy scores below 0.1 were defined as LE (boxed), and more detailed results are shown in panel b. (f) The 13 epitopes with diversity scores below 0.5 were defined as LD (boxed), and more detailed results are shown in panel g. Numbers in panels b and g indicate the number of participants targeting individual epitopes; unlabeled epitopes were targeted by only one participant. (c and h) Numbers of LE and LD epitopes, respectively, targeted by individual participants versus years to disease. (d and l) Numbers of LE and LD epitopes, respectively, targeted by individual participants versus years to disease data but with data for participant N (circle with a cross) excluded. (e and j) Magnitudes of CTL response against LE and LD epitopes, respectively, versus years until disease. All participants are represented in all graphs with the exception of those in panels d and i, in which data for participant N are excluded from the analysis. The relationships between breadth and magnitude and time until disease were also analyzed by adjusting for the time of sampling; the adjusted (adj.) P values are shown (c to e and h to j). Correlations and P values shown are calculated on the basis of Spearman's rank correlation.

