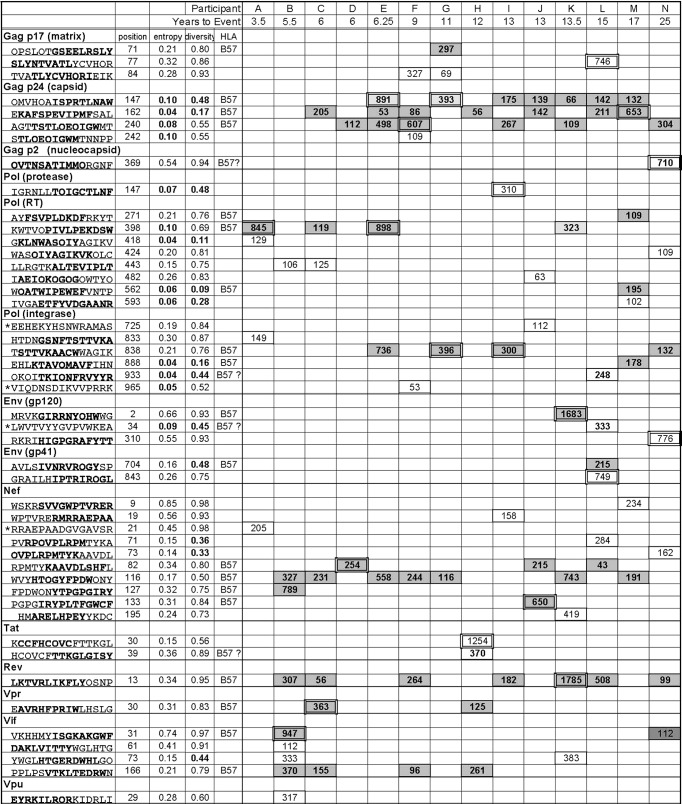
Table 2.
CTL epitopes targeted by 14 participantsa
Forty-seven peptides identified by IFN-γ ELISpot analysis. Values shown are number of SFCs/106 cells. The positions and entropy values refer to the boldfaced epitope within the 15-mer peptide. For four 15-mers for which it was not possible to identify the smaller epitope (*), the positions and entropy values refer to the entire 15-mer. Position numbering matches LANL HXB-2 alignment. The 13 lowest entropy values (≤0.1) and diversity values (1 − Ds ≤ 0.5) are indicated in bold in gray boxes. B57 denotes the 19 B57-resticted epitopes; the SFC values for these epitopes are in bold and boxed in dark gray. B57? denotes the four epitopes for which it was not possible to resolve whether they were restricted by B57 or another allele of the participant; the SFC values for these epitopes are in bold and boxed in light gray. The highest-magnitude response for each participant is double boxed. For participants E, G, I, K, L, and M, the 2nd-highest response was within 10% of the highest and is also double boxed.

