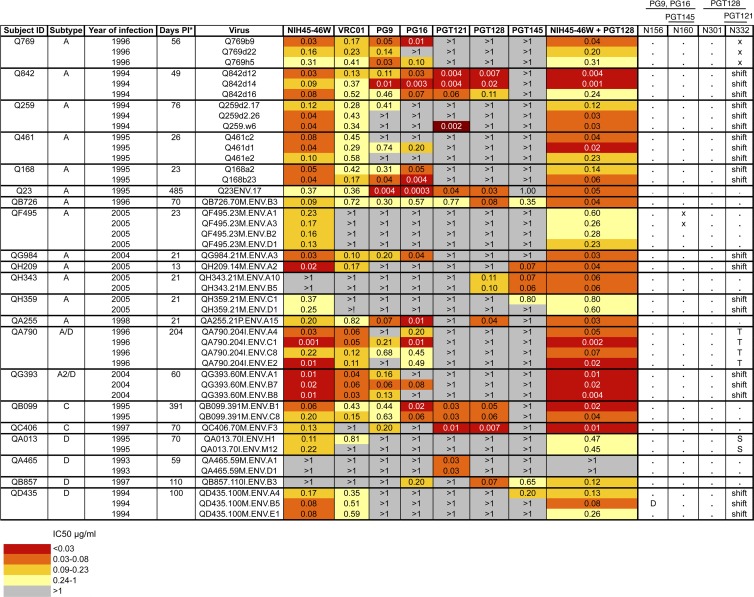
Fig 1.
Summary of neutralization profiles of panel viruses against MAbs. Subject ID, virus subtype based on V1-V5 envelope sequence, and calendar year of infection are shown in the first 3 columns. Each row shows the virus name, IC50 for MAbs tested, and known core residues based on HXB2 numbering required for neutralization by MAbs shown. Viruses were obtained as described previously (4, 5, 17). For some patients, multiple viruses were obtained from the same time point to represent the diversity of the virus population at that time point as determined by phylogenetic analysis (5). Symbols: asterisk, estimated days postinfection at which envelope clone was obtained; dot, amino acid is present; x, amino acid is present but not in a glycosylation sequon; shift, amino acid is present but in position 334; D, T, S, amino acid substitutions. Darker shading indicates increasing MAb potency, as indicated by the key at the bottom, grouped by quartiles of IC50 values for all virus-MAb combinations. Gray shading indicates that 50% neutralization was not achieved at the highest concentration of MAb tested (1 μg/ml). The combination of NIH45-46W and PGT128 was tested at a starting concentration of 1 μg/ml of each MAb. IC50 values shown are averages from at least 2 independent experiments performed in duplicate.

