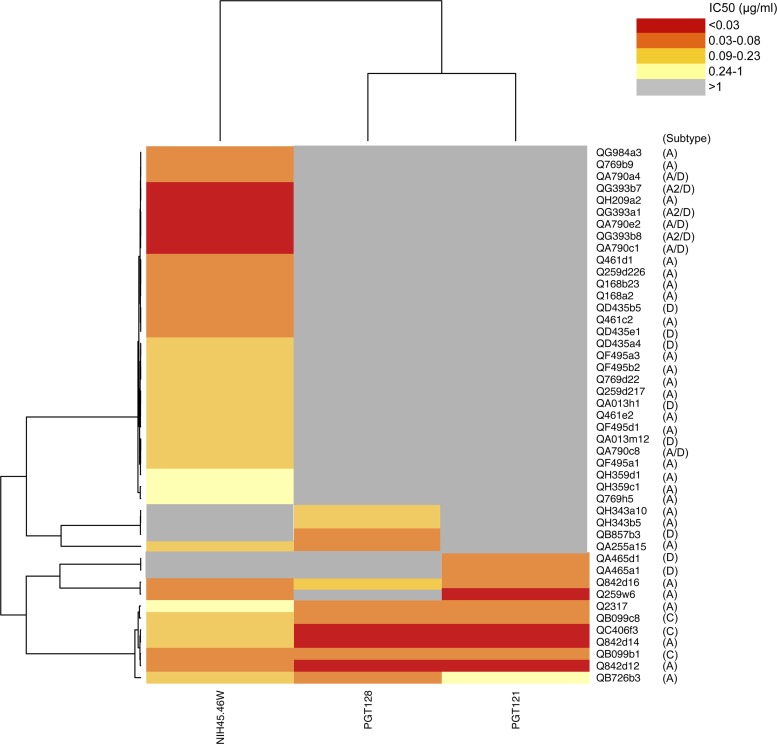
Fig 3.
Hierarchical clustering of MAbs NIH45-46W, PGT128, and PGT121 (bottom) and panel viruses (right). A heatmap of IC50 values for each virus-MAb combination is shown, with darker shading indicating increasing potency, as indicated by the key. Gray shading indicates that 50% neutralization was not achieved at the highest concentration of MAb tested (1 μg/ml).

