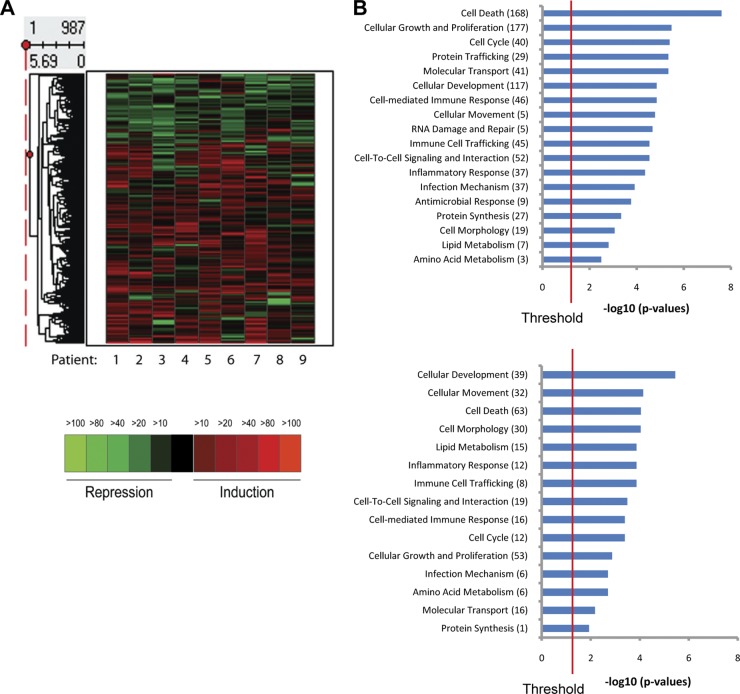
Fig 1.
Transcriptional profiling of laser-captured CD8+ T cells from biopsy specimens taken 8 weeks after healing and contralateral controls. (A) Heat map showing hierarchical clustering of differentially expressed genes (987 genes, 737 upregulated and 250 downregulated) between junction CD8+ cells (JC_CD8) and contralateral CD8+ T cells (CL_CD8) from nine patients. (B) Enriched functional categories in the up- and downregulated gene sets in panel A. The x axis represents the negative log10 P value calculated from the analysis of enriched functional categories using ingenuity pathway analysis.

