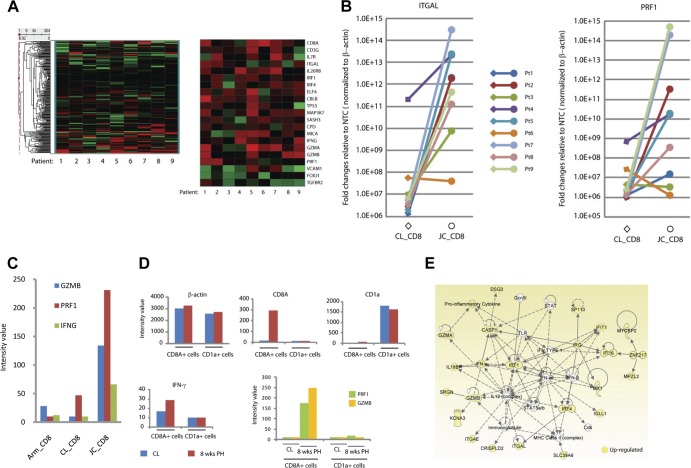
Fig 2.
JC_CD8+ T cells uniquely upregulated a network of genes involved in antimicrobial response. (A) Unsupervised hierarchical clustering heat maps showing the expression patterns of genes that were annotated to the GO terms T-cell activation and cytolysis. The left heat map shows the expression patterns of all 264 genes that were annotated to these two GO terms (out of the 18,401 genes on the Illumina human Ref8_v3 bead arrays); the right heat map shows the subset that are expressed differentially between JC_CD8 and CL_CD8 cells. (B) Quantitative RT-PCR (qRT-PCR) analysis shows that ITGAL and PRF1 were significantly upregulated in JC_CD8 relative to CL_CD8 cells. The y axis shows fold change of gene expression in JC_CD8 or CL_CD8 cells over that in nontemplate controls (NTC) after normalization to ACTB. Each reaction was done in duplicate. (C) JC_CD8 cells expressed GZMB, PRF1, and IFNG at significantly higher levels than Arm_CD8 and CL_CD8 cells. Data are from patient 5; similar results were seen with patient 4 (data not shown). (D) Antiviral gene expression patterns were associated with JC_CD8 cells but not with JC_CD1a cells from the same 8-week-posthealing (PH) biopsy specimens. Gene expression of ACTB, CD8A, CD1a, GZMB, PRF1, and INFG was compared in LCM-captured CD8A+ cells and CD1a+ cells from patient 1; similar results were obtained with patient 2 (data not shown). CL, contralateral. (E) JC_CD8 cells had higher levels of gene expression in an antimicrobial response network than CL_CD8 cells. A solid line between two molecules shows direct interaction; a dashed line shows indirect interaction.

