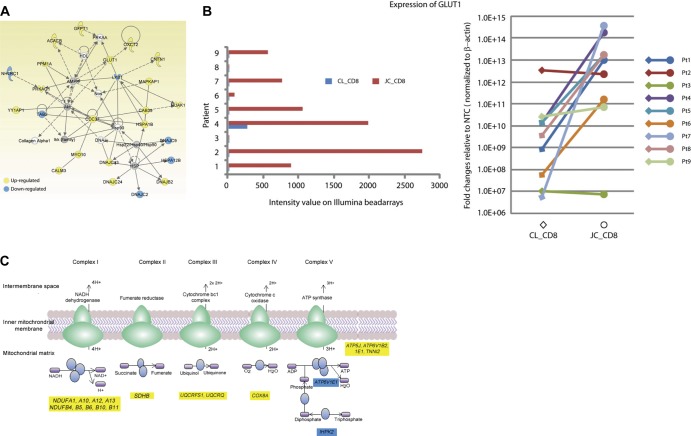
Fig 3.
JC_CD8 cells have a metabolic gene signature associated with activated T cells. (A) The differentially expressed gene set between JC_CD8 and CL_CD8 cells was significantly enriched for a network of genes involved in glucose and lipid metabolism. (B) JC_CD8 upregulation of GLUT1 relative to CL_CD8 cells. (Left) expression of GLUT1 assayed by microarray; (right) expression of GLUT1 assayed by qRT-PCR. The y axis shows fold change of gene expression in JC_CD8 or CL_CD8 cells over nontemplate controls (NTC) after normalization to β-actin (right panel). Pt, patient. Each reaction was done in duplicate. (C) JC_CD8 cells showed significant upregulation of genes in a canonical pathway for mitochondrial oxidative phosphorylation (blue ovals) relative to CL_CD8. Out of 165 genes in this pathway, JC_CD8 cells up- and downregulated 17 and 2 genes, respectively. Yellow, upregulated; blue downregulated.

