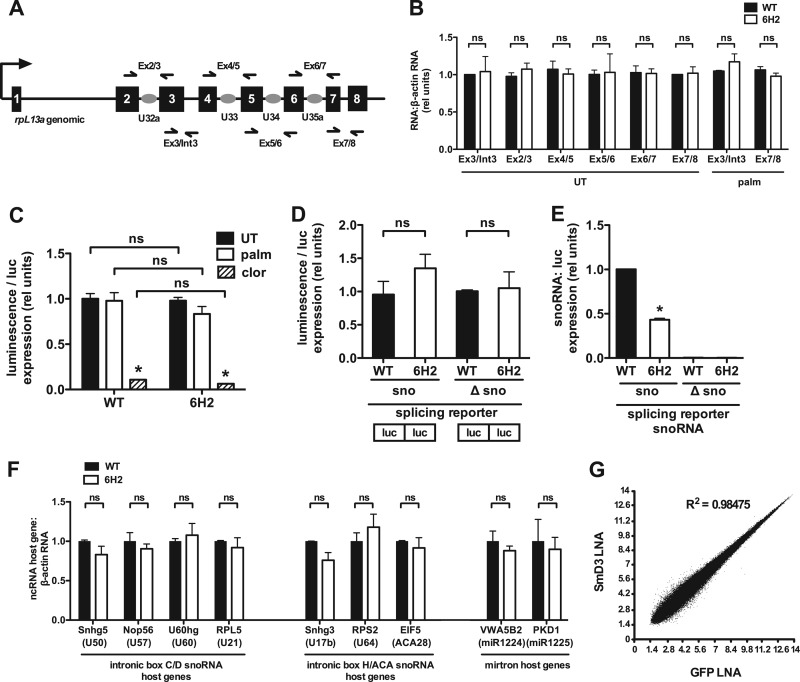
Fig 7.
Host gene expression is normal in 6H2 cells. (A) The rpL13a locus is shown, with the noncoding region (black lines), exons (black boxes), and snoRNAs (gray ovals). The full arrow indicates transcription start. Half arrows indicate locations of primers for qRT-PCR analysis of pre-mRNA and mRNA. (B) WT and 6H2 cells were untreated (UT) or treated with palmitate for 9 h. For analysis of rpL13a pre-mRNA expression, total RNA was reverse transcribed using random hexamers and amplified using primers that span the junction between exon 3 and intron 3. For analysis of rpL13a mRNA expression, total RNA was transcribed using oligo(dT) and amplified using primers that span exon-exon junctions. Primer pairs are as indicated in panel A. (C) WT and 6H2 cells were transfected with a split luciferase reporter containing a β-globin intron; 24 h posttransfection, the cells were left untreated or treated with palmitate or clotrimazole (clor) for 4 h. Luminescence was measured and normalized to luciferase pre-mRNA expression by qRT-PCR. (D and E) WT and 6H2 cells were transfected with a split luciferase construct containing the intact U32a intron (sno) or the U32a intron lacking the 83-nucleotide U32a snoRNA (Δsno). Total RNA was analyzed for luciferase pre-mRNA and U32a snoRNA expression. Luminescence (D) and U32a snoRNA (E) were normalized to luciferase pre-mRNA expression. Note that differences between the murine intronic sequences in the reporter construct and endogenous hamster sequences enabled discrimination between exogenous murine and endogenous hamster snoRNAs using species-specific PCR primers. (F) Total RNA was prepared from WT and 6H2 cells and analyzed for host genes of endogenous intron-encoded snoRNAs and mirtrons by qRT-PCR relative to β-actin mRNA. (G) Exon array analysis was used to predict differences in alternative splicing. Relative probe set intensity values from exon arrays were plotted for SmD3 LNA- versus GFP LNA-transfected cells using data from three independent samples/arrays for each condition. All data are expressed as means and SE for three independent experiments. *, P < 0.05; ns, not significant.

