Fig 4.
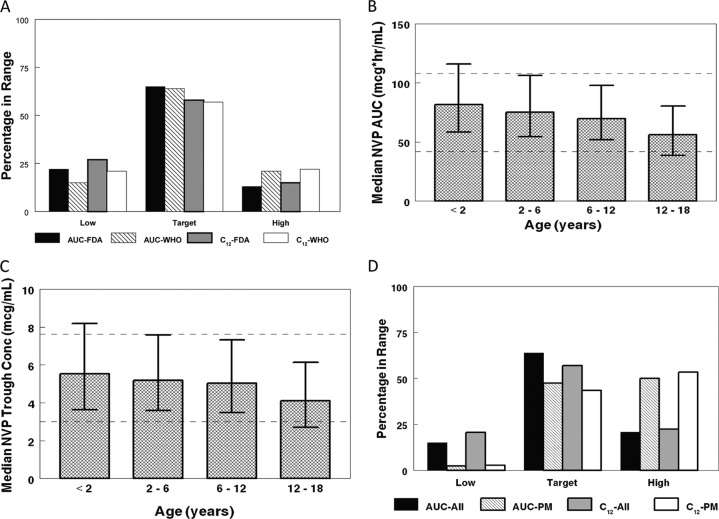
Monte Carlo simulations with WHO weight band dosing recommendations. (A) FDA dose (150 mg/m2 with a maximum of 200 mg, twice daily) compared to WHO weight band dosing for NVP exposure (area under the curve) and 12-h trough concentrations (C12). (B) Median drug exposure (area under the curve) for WHO weight banding dosing. Data are medians and interquartile ranges of NVP AUC (μg · h/ml). Target AUC levels are represented by dashed lines (42 to 108 μg · h/ml). (C) Median 12-h concentrations (trough levels) for WHO weight band dosing. Data are medians and interquartile ranges of NVP concentration (μg/ml). Goal trough concentrations are represented by dashed lines (3 to 7.6 μg/ml). (D) WHO weight band dosing for the overall study distribution of CYP2B6 genotype compared to a population of poor metabolizers (PM) (CYP2B6 516 TT). Area under the curve (AUC) and C12 (trough concentrations) are given.

