
Fig 2.
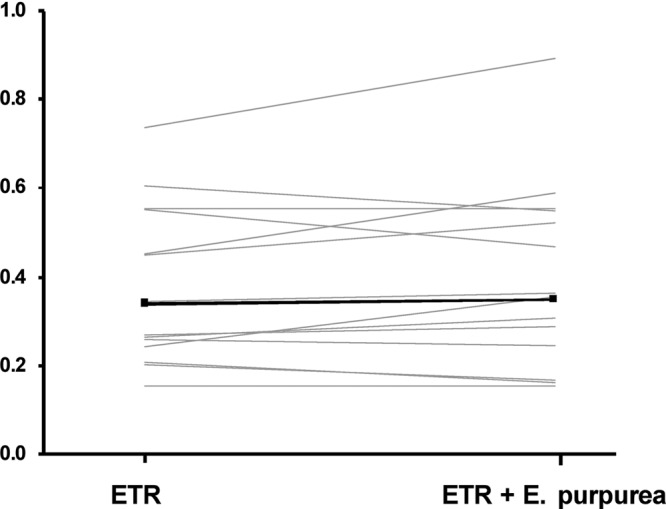
Etravirine (ETR) concentrations at the end of the dosing interval (C24) after administration of ETR with or without multiple doses of Echinacea purpurea. The gray lines represent individual values, and the black line represents the geometric mean.